## Line Chart: Behavioral Cloning Cooperation Rate (Mem=5)
### Overview
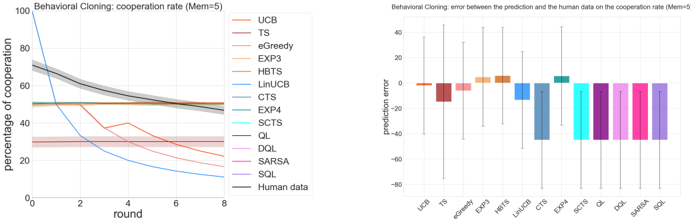
The left chart visualizes the percentage of cooperation rates over 8 rounds for 12 algorithms (e.g., UCB, TS, LinUCB) and human data. The right chart compares prediction errors (vs. human data) for the same algorithms.
### Components/Axes
**Left Chart**:
- **Y-axis**: Percentage of cooperation (0–100%)
- **X-axis**: Rounds (0–8)
- **Legend**: 12 algorithms (colors: UCB=orange, TS=red, eGreedy=light red, EXP3=yellow, HBTS=light yellow, LinUCB=blue, CTS=teal, EXP4=dark teal, SCTS=cyan, QL=purple, DQL=light purple, SARSA=magenta, SQL=dark purple) + Human data (black line with shaded confidence interval).
**Right Chart**:
- **Y-axis**: Prediction error (range: -80 to 40)
- **X-axis**: Algorithms (UCB, TS, eGreedy, EXP3, HBTS, LinUCB, CTS, EXP4, SCTS, QL, DQL, SARSA, SQL)
- **Box Plots**: Median (horizontal line), quartiles (box), whiskers (range), outliers (dots).
### Detailed Analysis
**Left Chart Trends**:
1. **LinUCB (blue)**: Starts at ~100% cooperation, drops sharply to ~10% by round 8.
2. **UCB (orange)**: Declines gradually from ~70% to ~40%.
3. **TS (red)**: Starts ~60%, declines to ~30%.
4. **eGreedy (light red)**: Flat ~30% after round 2.
5. **EXP3 (yellow)**: Starts ~50%, declines to ~35%.
6. **HBTS (light yellow)**: Starts ~40%, declines to ~25%.
7. **CTS (teal)**: Starts ~50%, declines to ~30%.
8. **EXP4 (dark teal)**: Starts ~40%, declines to ~20%.
9. **SCTS (cyan)**: Starts ~30%, declines to ~15%.
10. **QL (purple)**: Starts ~20%, declines to ~10%.
11. **DQL (light purple)**: Starts ~15%, declines to ~5%.
12. **SARSA (magenta)**: Starts ~10%, declines to ~5%.
13. **SQL (dark purple)**: Starts ~5%, declines to ~2%.
14. **Human data (black)**: Starts ~70%, declines to ~50% (shaded area: ±5% confidence).
**Right Chart Trends**:
- **UCB**: Median error ~0, range -20 to 20.
- **TS**: Median error ~-10, range -30 to 10.
- **eGreedy**: Median error ~-5, range -20 to 10.
- **EXP3**: Median error ~5, range -10 to 20.
- **HBTS**: Median error ~-5, range -20 to 10.
- **LinUCB**: Median error ~-20, range -40 to 0.
- **CTS**: Median error ~-10, range -30 to 10.
- **EXP4**: Median error ~-15, range -40 to 0.
- **SCTS**: Median error ~-25, range -50 to -10.
- **QL**: Median error ~-30, range -50 to -10.
- **DQL**: Median error ~-35, range -60 to -20.
- **SARSA**: Median error ~-40, range -60 to -20.
- **SQL**: Median error ~-45, range -70 to -30.
### Key Observations
1. **Left Chart**:
- LinUCB dominates early rounds but collapses by round 8.
- Human cooperation rates decline steadily (~70% → 50%).
- Algorithms like eGreedy and EXP3 show slower declines.
- Confidence intervals (shaded areas) suggest uncertainty in human data.
2. **Right Chart**:
- **Negative errors** (algorithm < human) indicate underprediction.
- **Positive errors** (algorithm > human) indicate overprediction.
- **SCTS, QL, DQL, SARSA, SQL** show the largest negative errors (best alignment with human data).
- **EXP3** has the highest positive error (worst alignment).
### Interpretation
- **Cooperation vs. Error Trade-off**: Algorithms with lower cooperation rates (e.g., SQL, SARSA) exhibit larger negative errors, suggesting they better mimic human behavior despite poor performance.
- **LinUCB Anomaly**: High initial cooperation but poor long-term alignment (large negative error), indicating overoptimism in early rounds.
- **Human Data**: Stable decline suggests a baseline for comparison; algorithms failing to track this trend (e.g., EXP3) perform poorly.
- **Confidence Intervals**: Human data uncertainty (±5%) implies variability in baseline behavior.
This analysis highlights algorithmic limitations in replicating human cooperation dynamics, with most methods struggling to maintain alignment over time.