## Bar Chart: Accuracy Comparison Across Metrics and Methods
### Overview
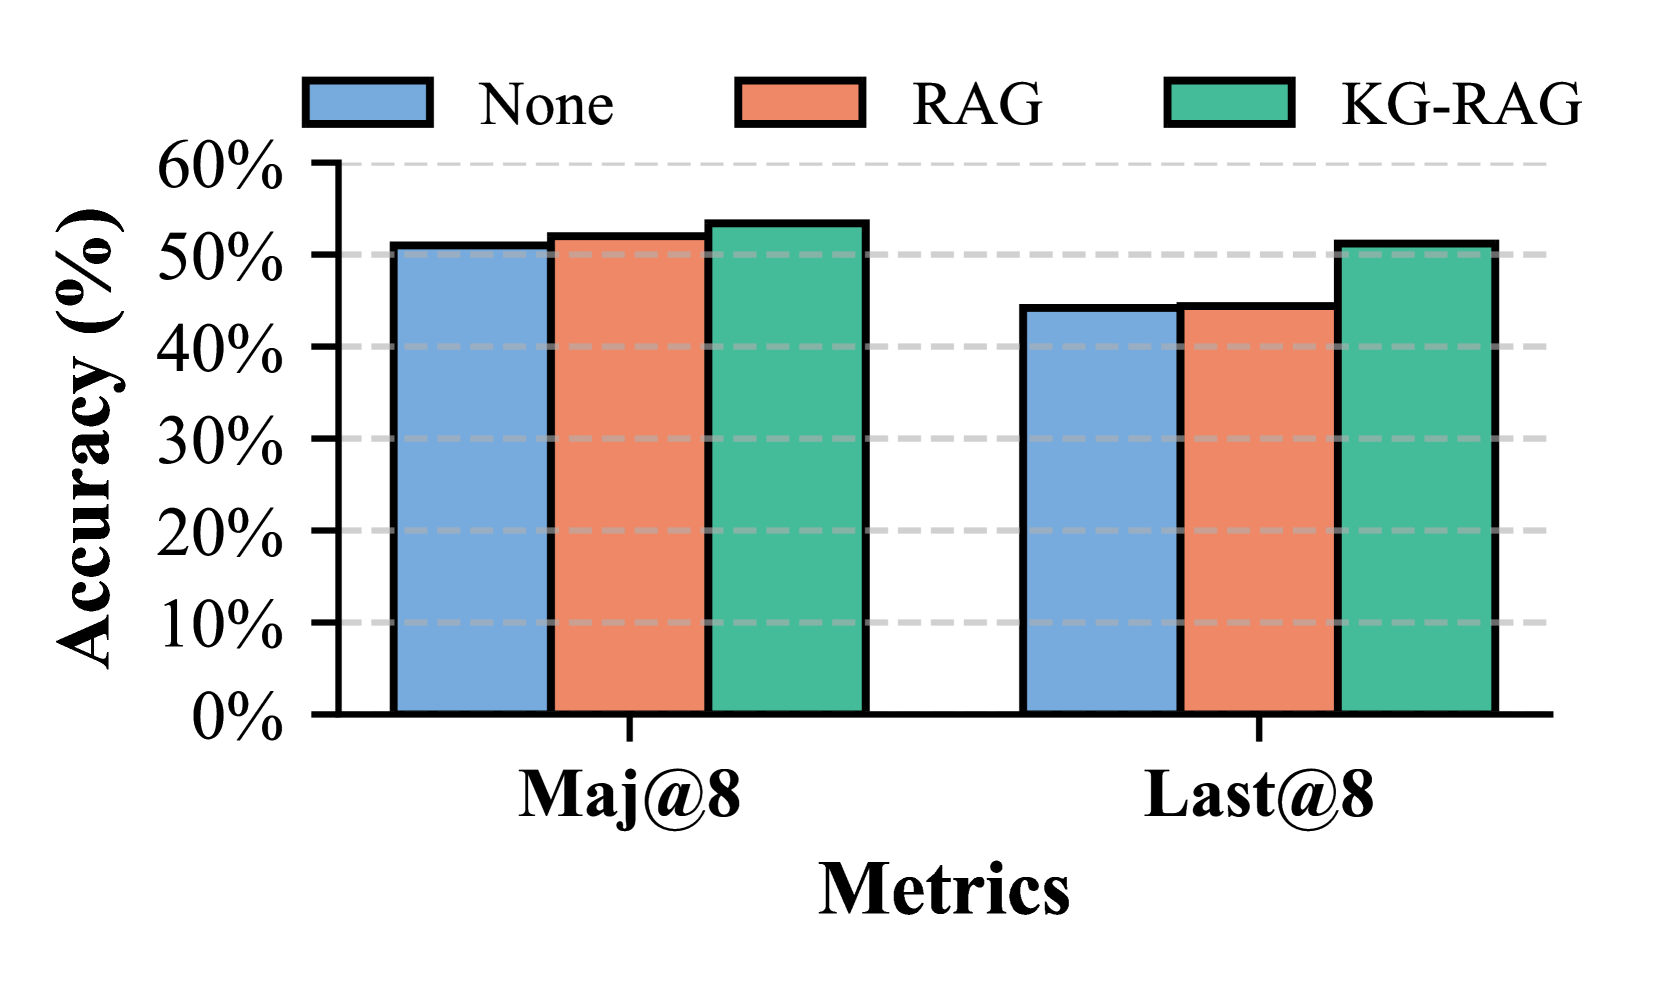
This image displays a bar chart comparing the accuracy of three different methods ("None", "RAG", and "KG-RAG") across two metrics ("Maj@8" and "Last@8"). The y-axis represents accuracy in percentage, ranging from 0% to 60%.
### Components/Axes
* **Title:** Implicitly, the chart title is a comparison of accuracy.
* **Y-axis Label:** "Accuracy (%)"
* **Scale:** 0%, 10%, 20%, 30%, 40%, 50%, 60%
* **X-axis Label:** "Metrics"
* **Categories:** "Maj@8", "Last@8"
* **Legend:** Located at the top-center of the chart.
* **"None"**: Represented by a blue square.
* **"RAG"**: Represented by an orange/coral square.
* **"KG-RAG"**: Represented by a teal/green square.
### Detailed Analysis
The chart is divided into two main sections on the x-axis, corresponding to the metrics "Maj@8" and "Last@8". Within each section, there are three bars representing the accuracy for "None", "RAG", and "KG-RAG" methods.
**For "Maj@8" metric:**
* **"None" (Blue bar):** The bar reaches approximately 51% accuracy.
* **"RAG" (Orange bar):** The bar reaches approximately 52% accuracy.
* **"KG-RAG" (Teal bar):** The bar reaches approximately 53% accuracy.
**For "Last@8" metric:**
* **"None" (Blue bar):** The bar reaches approximately 44% accuracy.
* **"RAG" (Orange bar):** The bar reaches approximately 44% accuracy.
* **"KG-RAG" (Teal bar):** The bar reaches approximately 51% accuracy.
### Key Observations
* **"Maj@8" Metric:** All three methods show very similar accuracy, with "KG-RAG" being slightly higher (approximately 53%) than "RAG" (approximately 52%) and "None" (approximately 51%). The difference between the highest and lowest is about 2 percentage points.
* **"Last@8" Metric:** There is a more noticeable difference in accuracy. "KG-RAG" achieves the highest accuracy (approximately 51%), while "None" and "RAG" have significantly lower and nearly identical accuracy (approximately 44%). The difference between the highest and lowest is about 7 percentage points.
* **Method Comparison:** "KG-RAG" consistently performs at or above the other methods across both metrics. It shows a substantial improvement over "None" and "RAG" for the "Last@8" metric.
* **Metric Comparison:** Accuracy generally decreases from "Maj@8" to "Last@8" for the "None" and "RAG" methods. However, "KG-RAG" maintains a high accuracy for "Maj@8" and shows a slight decrease but still remains the highest for "Last@8".
### Interpretation
The data suggests that the "KG-RAG" method is the most effective across both metrics, particularly for the "Last@8" metric where it demonstrates a significant advantage. The "RAG" method shows a marginal improvement over "None" for "Maj@8" but performs similarly to "None" for "Last@8". The "None" method, representing a baseline without any specific augmentation, shows the lowest or tied-lowest accuracy in both cases.
The performance difference between "Maj@8" and "Last@8" for "None" and "RAG" indicates that these methods might be more sensitive to the specific characteristics of the "Last@8" metric, leading to a drop in accuracy. In contrast, "KG-RAG" appears to be more robust, maintaining a high level of accuracy even for the "Last@8" metric. This implies that the knowledge graph integration in "KG-RAG" provides a benefit that helps in achieving better performance, especially when dealing with the challenges presented by the "Last@8" metric.