## Diagram: Sound Decomposition and Environmental Sound Signatures
### Overview
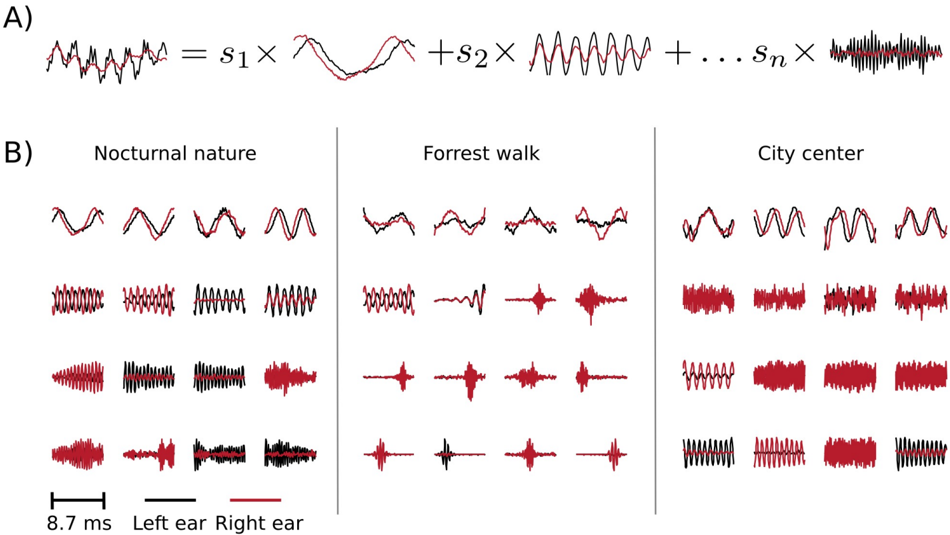
The image presents a diagram illustrating the decomposition of a complex sound into simpler components and showcasing sound signatures from different environments (Nocturnal nature, Forrest walk, City center). The diagram is divided into two main sections: A) Sound Decomposition and B) Environmental Sound Signatures.
### Components/Axes
**Section A: Sound Decomposition**
* Illustrates a complex waveform being decomposed into a sum of simpler waveforms.
* Equation: Complex Waveform = s1 x Waveform1 + s2 x Waveform2 + ... + sn x WaveformN
* s1, s2, ..., sn represent scaling factors.
**Section B: Environmental Sound Signatures**
* Three columns representing different environments: Nocturnal nature, Forrest walk, City center.
* Each environment has four rows of waveforms, representing different sound events within that environment.
* Each waveform is represented by two lines:
* Black line: Left ear
* Red line: Right ear
* Time scale: 8.7 ms (indicated by a horizontal bar at the bottom-left)
### Detailed Analysis
**Section A: Sound Decomposition**
* The complex waveform on the left is visually represented as a sum of scaled simpler waveforms.
* The equation suggests that any complex sound can be broken down into a combination of basic sound components.
**Section B: Environmental Sound Signatures**
* **Nocturnal nature:**
* Row 1: Relatively simple, sinusoidal waveforms with slight variations between left and right ears.
* Row 2: Higher frequency, more complex waveforms with clear differences between left and right ears.
* Row 3: Bursts of sound with varying amplitudes and durations, more prominent in the right ear.
* Row 4: Short bursts of sound, with some synchronization between left and right ears.
* **Forrest walk:**
* Row 1: Irregular waveforms with small amplitude variations.
* Row 2: Short bursts of high-frequency sound, primarily in the right ear.
* Row 3: Impulsive sounds, primarily in the right ear.
* Row 4: Very short, impulsive sounds, primarily in the right ear.
* **City center:**
* Row 1: Complex waveforms with moderate amplitude variations and some differences between left and right ears.
* Row 2: High-frequency, complex waveforms with significant amplitude variations and differences between left and right ears.
* Row 3: Dense, complex waveforms with high amplitude variations, primarily in the right ear.
* Row 4: Complex waveforms with rapid amplitude variations and some synchronization between left and right ears.
### Key Observations
* The sound signatures vary significantly across the three environments.
* The "Nocturnal nature" environment seems to have more continuous and structured sounds.
* The "Forrest walk" environment is characterized by short, impulsive sounds.
* The "City center" environment has complex and high-frequency sounds.
* The differences between the left and right ear waveforms suggest spatial information about the sound sources.
* The time scale (8.7 ms) indicates that these are very short sound samples.
### Interpretation
The diagram illustrates two key concepts: sound decomposition and environmental sound signatures. The sound decomposition section shows how complex sounds can be broken down into simpler components, which is a fundamental principle in sound analysis and synthesis. The environmental sound signatures section provides a visual representation of the characteristic sounds present in different environments. The differences in the waveforms across the environments reflect the unique acoustic properties of each location. The left and right ear differences suggest that these signatures could be used for sound localization or spatial audio analysis. The data suggests that each environment has a unique acoustic fingerprint that can be characterized by the types and patterns of sounds present.