\n
## Diagram: Soundscape Decomposition
### Overview
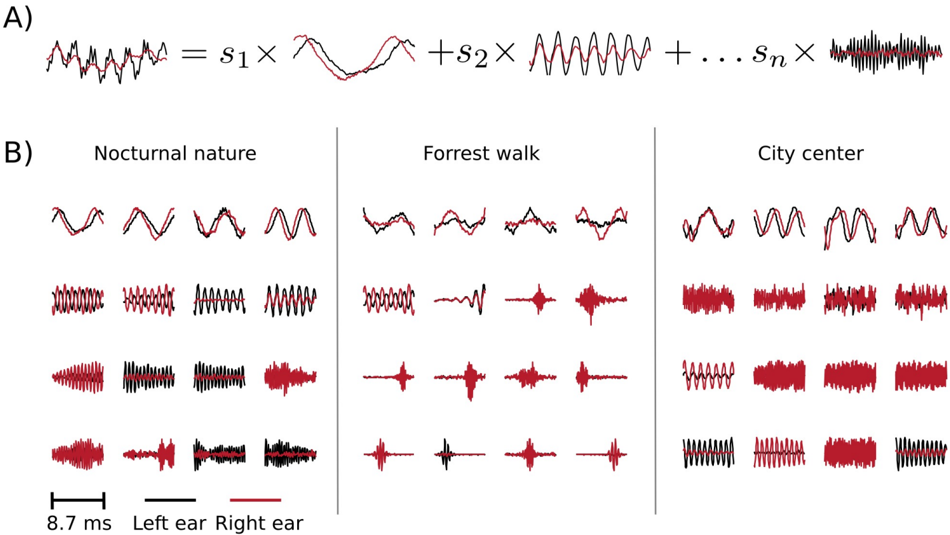
The image presents a diagram illustrating the decomposition of a complex soundscape into its constituent sound sources. Part A shows a mathematical representation of this decomposition, while Part B displays example waveforms for different environments: nocturnal nature, a forest walk, and a city center. Waveforms are shown for both the left and right ears.
### Components/Axes
* **Part A:** A mathematical equation representing soundscape decomposition. `s1` through `sn` represent individual sound sources. The 'X' symbol appears to represent a summation or combination of these sources.
* **Part B:** Three columns representing different environments: "Nocturnal nature", "Forrest walk", and "City center". Each column contains four rows of waveforms, presumably representing different sound sources or time segments.
* **Time Scale:** A horizontal bar labeled "8.7 ms" indicates the time scale for the waveforms.
* **Ear Labels:** Labels "Left ear" and "Right ear" are positioned below the time scale, indicating which waveforms correspond to each ear.
* **Waveform Color:** Red waveforms are consistently used throughout the diagram. Black waveforms are also used throughout the diagram.
### Detailed Analysis or Content Details
**Part A:**
The equation shows a complex soundscape being represented as the sum of individual sound sources (s1 to sn). The equation is: `waveform = s1 + s2 + ... + sn`.
**Part B:**
* **Nocturnal Nature:**
* Top Row (Red): A relatively slow, sinusoidal waveform with a consistent amplitude.
* Second Row (Black): A more complex waveform with higher frequency components and varying amplitude.
* Third Row (Red): A series of short, sharp pulses.
* Fourth Row (Black): A complex waveform with a mix of frequencies and amplitudes.
* **Forrest Walk:**
* Top Row (Red): A slow, sinusoidal waveform with a smaller amplitude than the nocturnal nature example.
* Second Row (Black): A waveform with a few distinct peaks and troughs.
* Third Row (Red): A series of short, sharp pulses, similar to the nocturnal nature example but less frequent.
* Fourth Row (Black): A complex waveform with a mix of frequencies and amplitudes.
* **City Center:**
* Top Row (Red): A fast, sinusoidal waveform with a relatively high frequency.
* Second Row (Black): A highly complex waveform with a very high frequency and amplitude.
* Third Row (Red): A series of short, sharp pulses, more frequent than in the other environments.
* Fourth Row (Black): A very complex waveform with a high frequency and amplitude.
The waveforms in each environment appear to be paired, with the top two rows being red and the bottom two rows being black. This suggests a distinction between different types of sound sources or processing stages.
### Key Observations
* The complexity of the waveforms increases from nocturnal nature to forest walk to city center. This suggests that the soundscapes become more diverse and chaotic in more urban environments.
* The presence of sharp pulses (red waveforms in the third row) is consistent across all environments, but their frequency varies.
* The waveforms for the left and right ears appear to be similar within each environment, suggesting that the sound sources are relatively symmetrical.
* The time scale (8.7 ms) provides a reference for the duration of the waveforms.
### Interpretation
This diagram demonstrates a method for decomposing complex soundscapes into their constituent sound sources. The mathematical equation in Part A provides a conceptual framework for this decomposition, while Part B illustrates how this framework can be applied to real-world environments. The different waveforms observed in each environment reflect the unique acoustic characteristics of that environment.
The increasing complexity of the waveforms from nocturnal nature to city center suggests that urban environments are characterized by a greater diversity of sound sources and more rapid changes in sound intensity. The presence of sharp pulses in all environments may represent transient sounds such as impacts or clicks.
The diagram highlights the importance of considering both the frequency and amplitude of sound waves when analyzing soundscapes. The different waveforms observed in each environment provide valuable information about the acoustic properties of that environment and can be used to inform soundscape design and management. The use of red and black waveforms may indicate different processing stages or types of sound sources, but further information would be needed to confirm this interpretation. The diagram is a conceptual illustration and does not provide quantitative data. It is a qualitative representation of soundscape decomposition.