## Line Chart: Cut-off Ratio vs. Token Length
### Overview
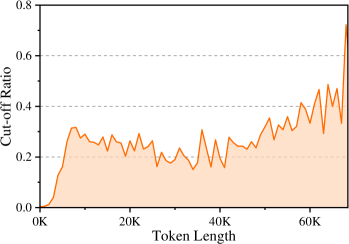
The image is a line chart showing the relationship between "Cut-off Ratio" (y-axis) and "Token Length" (x-axis). The chart displays a single data series, represented by an orange line, illustrating how the cut-off ratio changes with increasing token length.
### Components/Axes
* **X-axis:** Token Length, labeled from 0K to 60K.
* **Y-axis:** Cut-off Ratio, labeled from 0.0 to 0.8.
* **Data Series:** A single orange line representing the cut-off ratio.
### Detailed Analysis
The orange line represents the "Cut-off Ratio" data series.
* **Trend:** The line starts near 0.0 at 0K token length, rises sharply to approximately 0.3 around 5K token length, then fluctuates between 0.2 and 0.3 until around 40K token length. After 40K, the line gradually increases with more volatility, reaching approximately 0.6 at 70K token length.
* **Data Points (Approximate):**
* 0K Token Length: 0.0 Cut-off Ratio
* 5K Token Length: 0.3 Cut-off Ratio
* 20K Token Length: 0.25 Cut-off Ratio
* 40K Token Length: 0.25 Cut-off Ratio
* 60K Token Length: 0.4 Cut-off Ratio
* 70K Token Length: 0.6 Cut-off Ratio
### Key Observations
* The cut-off ratio is relatively low and stable for token lengths between 5K and 40K.
* The cut-off ratio increases significantly after 40K token length, with increased volatility.
### Interpretation
The chart suggests that the cut-off ratio is influenced by the token length. Initially, the ratio increases rapidly with token length, but then stabilizes. Beyond a certain token length (around 40K), the cut-off ratio becomes more sensitive to changes in token length, leading to higher values and greater fluctuations. This could indicate that longer token sequences introduce more complexity or variability, affecting the cut-off ratio.