\n
## Line Chart: Cut-off Ratio vs. Token Length
### Overview
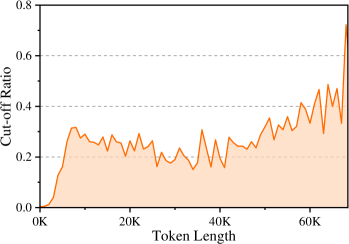
The image presents a line chart illustrating the relationship between "Token Length" and "Cut-off Ratio". The chart displays a single data series as an orange line with a shaded area underneath, representing a confidence interval or range. The chart appears to be investigating the impact of increasing token length on a cut-off ratio, potentially related to model performance or data processing.
### Components/Axes
* **X-axis:** "Token Length", ranging from 0K to 70K, with markers at 0K, 20K, 40K, and 60K.
* **Y-axis:** "Cut-off Ratio", ranging from 0.0 to 0.8, with markers at 0.0, 0.2, 0.4, and 0.6.
* **Data Series:** A single orange line representing the Cut-off Ratio as a function of Token Length.
* **Shaded Area:** An orange shaded area under the line, indicating a range or confidence interval.
* **Horizontal Lines:** Three dashed grey horizontal lines at approximately 0.2, 0.4, and 0.6 on the Y-axis.
### Detailed Analysis
The orange line starts at approximately 0.0 at 0K token length. It rises sharply to a peak of approximately 0.32 at around 10K token length. The line then fluctuates, generally decreasing to a low of approximately 0.18 at around 25K token length. From 25K to 50K, the line exhibits a wavy pattern, oscillating between approximately 0.2 and 0.3. Finally, from 50K to 70K, the line shows a significant upward trend, increasing from approximately 0.3 to 0.68 at 70K.
Approximate data points:
* 0K: 0.0
* 10K: 0.32
* 20K: 0.25
* 25K: 0.18
* 30K: 0.22
* 40K: 0.28
* 50K: 0.30
* 60K: 0.40
* 70K: 0.68
### Key Observations
* The Cut-off Ratio generally increases with Token Length, especially after 50K.
* There is significant fluctuation in the Cut-off Ratio between 10K and 50K token lengths.
* The initial increase in Cut-off Ratio is rapid, but then stabilizes before increasing again at higher token lengths.
* The horizontal lines at 0.2, 0.4, and 0.6 may represent thresholds or benchmarks for the Cut-off Ratio.
### Interpretation
The chart suggests that as the token length increases, the cut-off ratio initially rises quickly, then plateaus with some variability, and finally experiences a substantial increase at higher token lengths. This could indicate that shorter token lengths are less effective at achieving a desired cut-off, while longer token lengths improve performance up to a point. The fluctuations between 10K and 50K might represent the sensitivity of the cut-off ratio to variations in the input data or model parameters. The steep increase after 50K suggests a potential threshold where longer token lengths become significantly more beneficial. The horizontal lines could be used to evaluate the performance of the system at different cut-off ratio levels. The data suggests that there is a trade-off between token length and cut-off ratio, and the optimal token length depends on the desired level of cut-off.