\n
## Line Chart: Cut-off Ratio vs. Token Length
### Overview
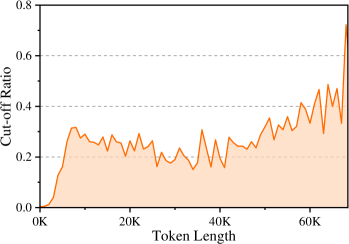
The image is a line chart with a filled area underneath, plotting the "Cut-off Ratio" against "Token Length." The chart illustrates how the cut-off ratio changes as the token length increases from 0 to over 60,000 tokens. The overall trend shows an initial sharp rise, followed by a period of fluctuation, and then a more volatile, increasing trend at higher token lengths.
### Components/Axes
* **X-Axis (Horizontal):**
* **Label:** "Token Length"
* **Scale:** Linear scale from 0K to beyond 60K.
* **Major Tick Marks:** 0K, 20K, 40K, 60K.
* **Y-Axis (Vertical):**
* **Label:** "Cut-off Ratio"
* **Scale:** Linear scale from 0.0 to 0.8.
* **Major Tick Marks:** 0.0, 0.2, 0.4, 0.6, 0.8.
* **Data Series:**
* A single data series represented by a solid orange line.
* The area under the line is filled with a semi-transparent orange color.
* **Legend:** No explicit legend is present. The single data series is identified by its color and axis labels.
* **Spatial Layout:** The chart is contained within a rectangular frame. The axes form the left and bottom borders. The title or caption is not visible within the cropped image.
### Detailed Analysis
* **Trend Description:** The line begins at a cut-off ratio of approximately 0.0 at 0K tokens. It rises steeply to about 0.3 by roughly 5K tokens. From ~5K to ~40K tokens, the ratio fluctuates in a band between approximately 0.15 and 0.3, with no strong directional trend. After ~40K tokens, the line exhibits a clear upward trend with significantly increased volatility (larger, more frequent peaks and valleys). The line reaches its highest point, a peak of approximately 0.7, at the far right of the chart, corresponding to a token length slightly beyond 60K.
* **Key Data Points (Approximate):**
* At Token Length 0K: Cut-off Ratio ≈ 0.0
* At Token Length ~5K: Cut-off Ratio ≈ 0.3 (first local peak)
* At Token Length ~20K: Cut-off Ratio ≈ 0.25
* At Token Length ~40K: Cut-off Ratio ≈ 0.2
* At Token Length ~50K: Cut-off Ratio ≈ 0.35
* At Token Length ~60K: Cut-off Ratio ≈ 0.45
* At Token Length >60K (end of chart): Cut-off Ratio ≈ 0.7 (global maximum)
### Key Observations
1. **Two-Phase Behavior:** The data suggests two distinct regimes: a relatively stable, low-volatility phase for token lengths up to ~40K, and a high-volatility, increasing phase beyond ~40K.
2. **Increased Volatility with Length:** The magnitude of the fluctuations (the "spikiness" of the line) increases noticeably as token length grows, particularly after the 40K mark.
3. **Overall Positive Correlation:** Despite the fluctuations, the general direction of the line is upward, indicating a positive correlation between token length and cut-off ratio.
4. **Sharp Initial Increase:** The most rapid change in the ratio occurs at the very beginning, from 0K to ~5K tokens.
### Interpretation
This chart likely visualizes a performance or behavioral metric of a system processing sequential data (like text tokens). The "Cut-off Ratio" could represent a truncation rate, an error rate, a resource utilization threshold, or a similarity score decay.
The data suggests that the system's behavior is relatively predictable and stable for shorter sequences (under 40K tokens). However, as sequences become very long (approaching and exceeding 60K tokens), the measured outcome becomes both higher on average and much less predictable, as evidenced by the large swings in the ratio. This could indicate that the system encounters edge cases, memory limitations, or compounding errors when handling extremely long contexts, leading to more erratic cutoff behavior. The sharp initial rise might represent a warm-up phase or the point where a baseline process engages. The lack of a plateau suggests that, within the observed range, the cut-off ratio does not stabilize for very long sequences.