## Line Chart: Cut-off Ratio vs. Token Length
### Overview
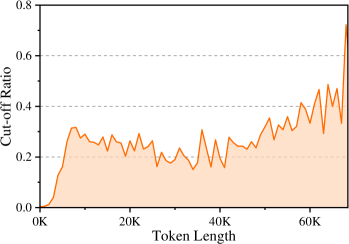
The image depicts a line chart with a shaded area under the curve, illustrating the relationship between "Token Length" (x-axis) and "Cut-off Ratio" (y-axis). The chart spans token lengths from 0K to 60K, with the cut-off ratio ranging from 0.0 to 0.8. A single orange line represents the cut-off ratio trend, accompanied by a shaded orange region beneath it. A legend in the top-right corner confirms the orange line corresponds to the "Cut-off Ratio."
### Components/Axes
- **X-axis (Token Length)**: Labeled "Token Length," with markers at 0K, 20K, 40K, and 60K. The scale is linear, incrementing by 20K.
- **Y-axis (Cut-off Ratio)**: Labeled "Cut-off Ratio," with markers at 0.0, 0.2, 0.4, 0.6, and 0.8. The scale is linear, incrementing by 0.2.
- **Legend**: Positioned in the top-right corner, with an orange label "Cut-off Ratio" matching the line and shaded area.
- **Line**: Orange, with a shaded orange region beneath it, indicating the area under the curve.
### Detailed Analysis
- **Initial Trend (0K–10K)**: The line starts near 0.0 at 0K, rising sharply to approximately 0.3 by 10K.
- **Mid-Range Fluctuations (10K–40K)**: The line oscillates between ~0.1 and ~0.3, with no clear upward or downward trend. Notable peaks occur near 20K (~0.25) and 30K (~0.3).
- **Late-Stage Rise (40K–60K)**: The line increases steadily from ~0.2 at 40K to ~0.5 at 60K, with a sharp spike to ~0.7 at 60K.
- **Shaded Area**: The region under the line suggests cumulative cut-off ratio values, though no explicit numerical integration is provided.
### Key Observations
1. **Sharp Initial Increase**: A rapid rise in cut-off ratio occurs within the first 10K tokens.
2. **Volatility in Mid-Range**: The cut-off ratio fluctuates unpredictably between 10K and 40K tokens.
3. **Accelerated Growth at End**: A significant upward trend dominates the final 20K tokens, culminating in a steep spike at 60K.
4. **Shaded Area Magnitude**: The shaded region grows exponentially, reflecting cumulative cut-off ratios.
### Interpretation
The chart suggests a non-linear relationship between token length and cut-off ratio. The initial spike may indicate a threshold effect, where early tokens disproportionately influence the cut-off ratio. The mid-range volatility could reflect noise or variability in data processing, while the late-stage acceleration implies a critical mass effect, where longer token lengths drive a rapid increase in the cut-off ratio. The shaded area emphasizes the cumulative impact of token lengths on the ratio, potentially highlighting resource allocation or efficiency trends in a computational or linguistic model. The sharp 60K spike warrants further investigation, as it deviates from the gradual rise observed earlier.