## Line Chart: Model Performance Comparison
### Overview
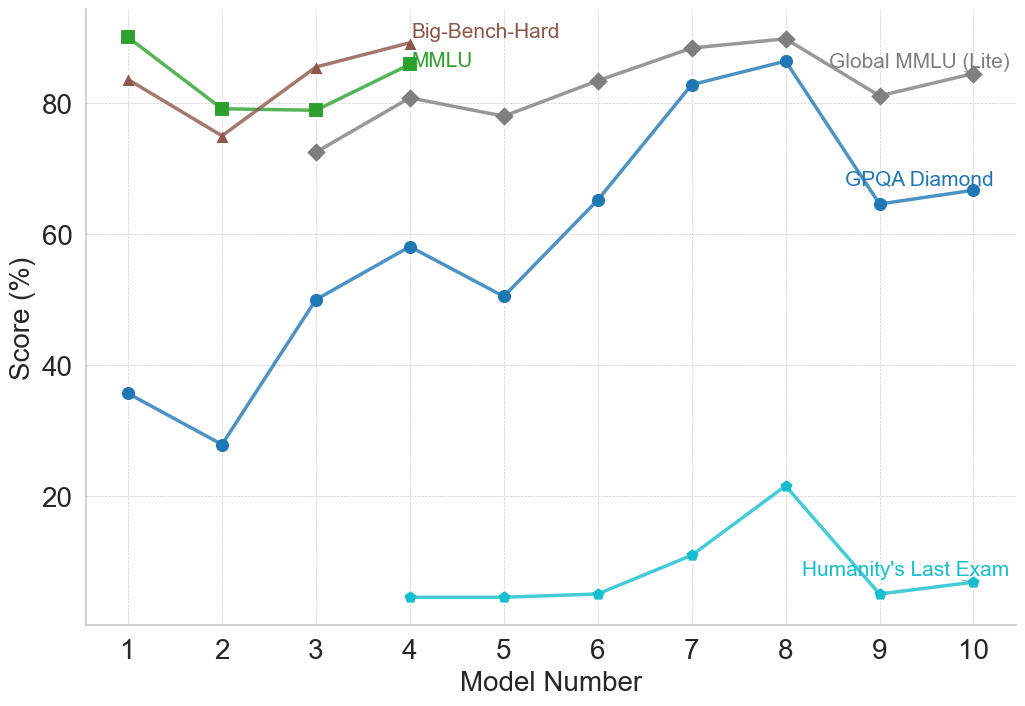
The image is a line chart comparing the performance of different models across several benchmarks. The x-axis represents the model number (1 to 10), and the y-axis represents the score in percentage (%). There are four data series, each representing a different benchmark: Big-Bench-Hard, MMLU, Global MMLU (Lite), GPQA Diamond, and Humanity's Last Exam.
### Components/Axes
* **X-axis:** Model Number (1 to 10, incrementing by 1)
* **Y-axis:** Score (%) (0 to 80, incrementing by 20)
* **Legend:** Located at the top-right of the chart.
* Big-Bench-Hard (Brown line with triangle markers)
* MMLU (Green line with square markers)
* Global MMLU (Lite) (Gray line with diamond markers)
* GPQA Diamond (Blue line with circle markers)
* Humanity's Last Exam (Light Blue line with diamond markers)
### Detailed Analysis
* **Big-Bench-Hard (Brown):**
* Trend: Relatively stable, with a slight increase overall.
* Model 1: ~84%
* Model 2: ~75%
* Model 3: ~82%
* Model 4: ~85%
* **MMLU (Green):**
* Trend: Relatively stable, with a slight decrease overall.
* Model 1: ~90%
* Model 2: ~79%
* Model 3: ~79%
* Model 4: ~81%
* **Global MMLU (Lite) (Gray):**
* Trend: Increasing initially, then plateauing, and finally decreasing slightly.
* Model 3: ~72%
* Model 4: ~81%
* Model 5: ~78%
* Model 6: ~83%
* Model 7: ~88%
* Model 8: ~89%
* Model 9: ~81%
* Model 10: ~88%
* **GPQA Diamond (Blue):**
* Trend: Increasing significantly, peaking at Model 8, then decreasing.
* Model 1: ~36%
* Model 2: ~28%
* Model 3: ~50%
* Model 4: ~58%
* Model 5: ~51%
* Model 6: ~66%
* Model 7: ~82%
* Model 8: ~86%
* Model 9: ~66%
* Model 10: ~68%
* **Humanity's Last Exam (Light Blue):**
* Trend: Very low scores, with a peak at Model 8.
* Model 4: ~6%
* Model 5: ~6%
* Model 6: ~7%
* Model 7: ~11%
* Model 8: ~22%
* Model 9: ~8%
* Model 10: ~9%
### Key Observations
* The Global MMLU (Lite) benchmark generally yields the highest scores across the models.
* GPQA Diamond shows the most significant performance variation across the models, with a notable peak at Model 8.
* Humanity's Last Exam consistently results in the lowest scores, indicating it is a challenging benchmark for these models.
* Big-Bench-Hard and MMLU benchmarks show relatively stable performance across the models.
### Interpretation
The chart provides a comparative analysis of model performance across different benchmarks. The varying trends suggest that different models excel at different tasks. The GPQA Diamond benchmark appears to be more sensitive to model architecture or training, given the wide range of scores. The consistently low scores on Humanity's Last Exam suggest that this benchmark may require specific capabilities or knowledge that the models generally lack. The stable performance of Big-Bench-Hard and MMLU might indicate that these benchmarks are less discriminating among the models tested. Overall, the data highlights the importance of evaluating models on a diverse set of benchmarks to understand their strengths and weaknesses.