## Line Chart: Model Performance Comparison
### Overview
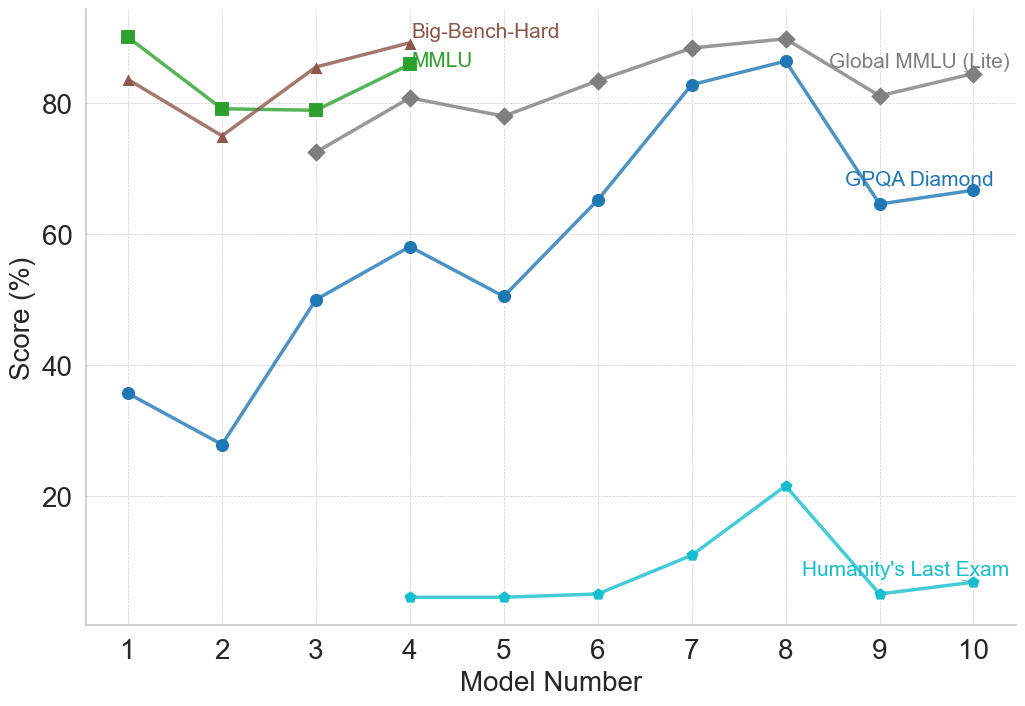
This line chart compares the performance of several models across different benchmarks. The x-axis represents the Model Number (ranging from 1 to 10), and the y-axis represents the Score (%) achieved on each benchmark. Five different benchmarks are represented by distinct colored lines: Big-Bench-Hard, MMLU, Global MMLU (Lite), GPQA Diamond, and Humanity's Last Exam.
### Components/Axes
* **X-axis:** Model Number (1 to 10). The axis is labeled "Model Number".
* **Y-axis:** Score (%). The axis is labeled "Score (%)". The scale ranges from approximately 0% to 90%.
* **Legend:** Located in the top-right corner of the chart. It identifies each line with its corresponding benchmark name and color.
* Big-Bench-Hard (Dark Green)
* MMLU (Green)
* Global MMLU (Lite) (Brown)
* GPQA Diamond (Blue)
* Humanity's Last Exam (Cyan)
### Detailed Analysis
Here's a breakdown of each line's trend and approximate data points:
* **Big-Bench-Hard (Dark Green):** The line starts at approximately 85% at Model 1, decreases to around 75% at Model 2, then fluctuates between 75% and 85% for Models 3-10, ending at approximately 82% at Model 10.
* **MMLU (Green):** The line begins at approximately 88% at Model 1, decreases to around 78% at Model 2, increases to approximately 85% at Model 3, remains relatively stable around 80-85% for Models 4-9, and ends at approximately 83% at Model 10.
* **Global MMLU (Lite) (Brown):** The line starts at approximately 78% at Model 1, decreases to around 72% at Model 2, increases to approximately 78% at Model 3, remains relatively stable around 78-82% for Models 4-10, ending at approximately 80% at Model 10.
* **GPQA Diamond (Blue):** The line starts at approximately 40% at Model 1, decreases to around 30% at Model 4, increases to approximately 60% at Model 6, rises to approximately 85% at Model 8, decreases to approximately 70% at Model 9, and ends at approximately 75% at Model 10.
* **Humanity's Last Exam (Cyan):** The line begins at approximately 30% at Model 1, decreases to around 5% at Model 4, increases to approximately 10% at Model 6, rises to approximately 25% at Model 8, decreases to approximately 5% at Model 9, and ends at approximately 10% at Model 10.
### Key Observations
* **High Performers:** Big-Bench-Hard and MMLU consistently achieve the highest scores, generally above 75%.
* **Low Performers:** Humanity's Last Exam consistently has the lowest scores, rarely exceeding 30%.
* **Significant Improvement (GPQA Diamond):** GPQA Diamond shows the most significant improvement in score across the models, starting low and peaking around Model 8.
* **Stability (Global MMLU Lite):** Global MMLU (Lite) exhibits the most stable performance, with minimal fluctuations in score.
* **Dip at Model 2:** Big-Bench-Hard, MMLU, and Global MMLU (Lite) all experience a dip in performance at Model 2.
### Interpretation
The chart demonstrates the performance of different models on a variety of benchmarks. The varying trends suggest that different models excel at different types of tasks. The consistent high performance of Big-Bench-Hard and MMLU indicates their robustness across a range of challenges. The dramatic improvement of GPQA Diamond suggests that certain models benefit significantly from increased model number, potentially indicating a learning or scaling effect. The consistently low scores of Humanity's Last Exam may indicate that this benchmark is particularly difficult or that the models are not well-suited for the type of reasoning it requires. The dip in performance at Model 2 for several benchmarks could indicate a specific challenge or limitation in that model's architecture or training data. The overall trend suggests that increasing the model number generally leads to improved performance, but the extent of improvement varies depending on the benchmark.