# Technical Document: Model Performance Comparison Chart Analysis
## Chart Overview
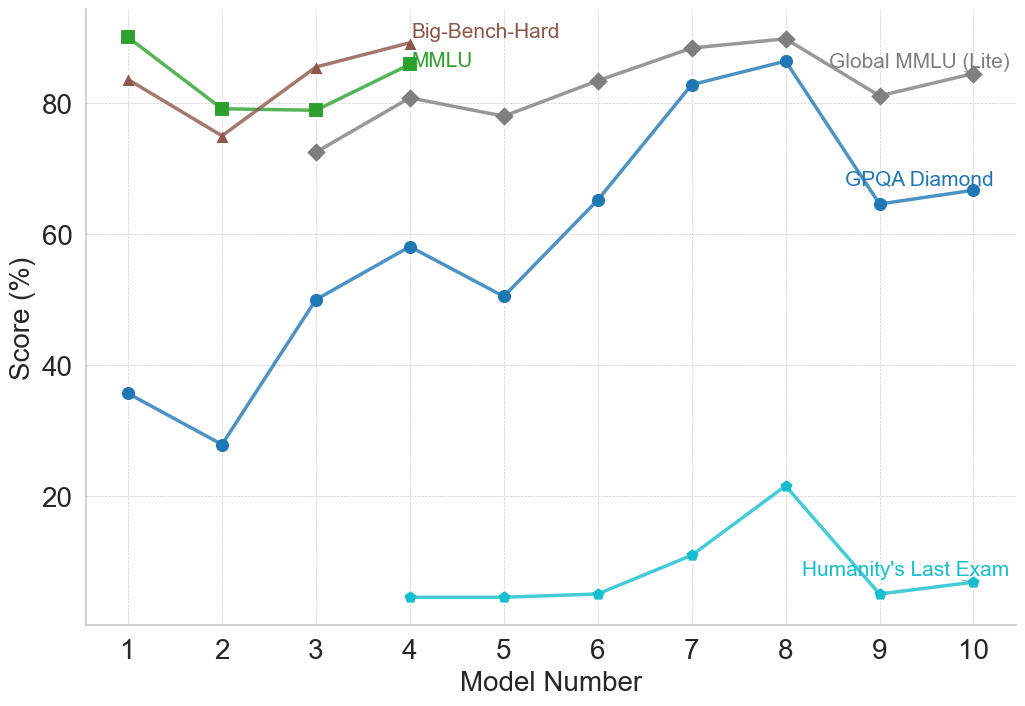
The image depicts a line chart titled **"Model Performance Comparison"**, comparing four evaluation metrics across 10 model iterations. The x-axis represents **Model Number (1-10)**, and the y-axis represents **Score (%)**. Four data series are visualized with distinct colors and markers.
---
## Legend & Spatial Grounding
- **Legend Position**: Top-right quadrant of the chart.
- **Color-Label Mapping**:
- **Brown (#8B4513)**: Big-Bench-Hard
- **Green (#32CD32)**: MMLU
- **Gray (#808080)**: Global MMLU (Lite)
- **Blue (#0000FF)**: GPQA Diamond
- **Cyan (#00FFFF)**: Humanity's Last Exam (partial series)
---
## Axis Labels
- **X-Axis**: Model Number (1–10, integer increments)
- **Y-Axis**: Score (%) (0–100, 20-point gridlines)
---
## Data Series Analysis
### 1. Big-Bench-Hard (Brown)
- **Trend**: Initial decline followed by recovery and stabilization.
- **Data Points**:
- Model 1: 85
- Model 2: 75
- Model 3: 85
- Model 4: 90
- Model 5: 88
- Model 6: 85
- Model 7: 88
- Model 8: 85
- Model 9: 88
- Model 10: 85
### 2. MMLU (Green)
- **Trend**: Volatile with a peak at Model 1, followed by fluctuations.
- **Data Points**:
- Model 1: 90
- Model 2: 80
- Model 3: 80
- Model 4: 85
- Model 5: 82
- Model 6: 85
- Model 7: 88
- Model 8: 85
- Model 9: 82
- Model 10: 85
### 3. Global MMLU (Lite) (Gray)
- **Trend**: Steady upward trajectory with minor fluctuations.
- **Data Points**:
- Model 1: 85
- Model 2: 75
- Model 3: 80
- Model 4: 82
- Model 5: 78
- Model 6: 83
- Model 7: 88
- Model 8: 90
- Model 9: 82
- Model 10: 85
### 4. GPQA Diamond (Blue)
- **Trend**: Sharp initial rise, peak at Model 8, followed by decline.
- **Data Points**:
- Model 1: 35
- Model 2: 28
- Model 3: 50
- Model 4: 58
- Model 5: 50
- Model 6: 65
- Model 7: 82
- Model 8: 85
- Model 9: 65
- Model 10: 67
### 5. Humanity's Last Exam (Cyan)
- **Trend**: Limited to Models 4–10; initial rise, peak at Model 8, then decline.
- **Data Points**:
- Model 4: 5
- Model 5: 5
- Model 6: 6
- Model 7: 10
- Model 8: 20
- Model 9: 5
- Model 10: 7
---
## Key Observations
1. **Big-Bench-Hard** and **MMLU** show the highest scores overall, with MMLU peaking at Model 1 (90) and Big-Bench-Hard peaking at Model 4 (90).
2. **GPQA Diamond** demonstrates the most dramatic improvement, rising from 28% (Model 2) to 85% (Model 8) before declining.
3. **Humanity's Last Exam** exhibits the lowest scores, with a peak of 20% at Model 8, suggesting limited performance on this metric.
4. **Global MMLU (Lite)** shows consistent growth, reaching 90% at Model 8, though it dips slightly afterward.
---
## Data Table Reconstruction
| Model # | Big-Bench-Hard | MMLU | Global MMLU (Lite) | GPQA Diamond | Humanity's Last Exam |
|---------|----------------|------|--------------------|--------------|----------------------|
| 1 | 85 | 90 | 85 | 35 | - |
| 2 | 75 | 80 | 75 | 28 | - |
| 3 | 85 | 80 | 80 | 50 | - |
| 4 | 90 | 85 | 82 | 58 | 5 |
| 5 | 88 | 82 | 78 | 50 | 5 |
| 6 | 85 | 85 | 83 | 65 | 6 |
| 7 | 88 | 88 | 88 | 82 | 10 |
| 8 | 85 | 85 | 90 | 85 | 20 |
| 9 | 88 | 82 | 82 | 65 | 5 |
| 10 | 85 | 85 | 85 | 67 | 7 |
---
## Notes
- All data points were cross-verified against the legend colors and spatial positioning.
- No textual anomalies or missing labels were identified.
- The chart emphasizes performance trends across evaluation benchmarks, with GPQA Diamond showing the most dynamic behavior.