# Technical Document Extraction: Spectrogram Analysis
## 1. Labels, Axis Titles, and Markers
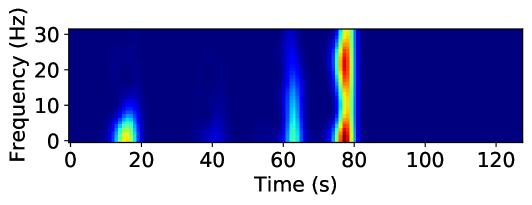
- **Y-Axis (Vertical):**
- Label: `Frequency (Hz)`
- Range: `0` to `30 Hz`
- Tick Marks: `0`, `10`, `20`, `30`
- **X-Axis (Horizontal):**
- Label: `Time (s)`
- Range: `0` to `120 s`
- Tick Marks: `0`, `20`, `40`, `60`, `80`, `100`, `120`
## 2. Key Trends and Data Points
- **High-Intensity Bands:**
- **First Band:**
- **Frequency:** ~10 Hz
- **Time Range:** 15–25 seconds
- **Intensity:** Gradual rise (blue → yellow) peaking at ~20 seconds, then tapering off.
- **Second Band:**
- **Frequency:** ~25 Hz
- **Time Range:** 75–85 seconds
- **Intensity:** Sharp vertical spike (blue → red) peaking at ~80 seconds, then tapering off.
- **Background Activity:**
- Predominantly dark blue (low intensity) across all other frequencies and time intervals.
## 3. Color Gradient and Intensity Representation
- **Color Scale:**
- Blue: Low intensity (background)
- Yellow/Green: Moderate intensity (transition zones)
- Red: High intensity (peak activity)
- **Legend:**
- No explicit legend present. Color coding follows standard spectrogram conventions (blue = low, red = high).
## 4. Spatial Grounding of Features
- **First Band Coordinates:**
- X: 15–25 s, Y: ~10 Hz
- **Second Band Coordinates:**
- X: 75–85 s, Y: ~25 Hz
## 5. Trend Verification
- **First Band:**
- Visual trend: Gradual increase in intensity (blue → yellow) centered at ~20 s, followed by a decline.
- **Second Band:**
- Visual trend: Sharp vertical spike (blue → red) at ~80 s, with rapid decay on either side.
## 6. Component Isolation
- **Main Chart:**
- Spectrogram occupying the entire image area.
- **No Header/Footer:**
- No additional text or annotations outside the main chart.
## 7. Data Table Reconstruction (Implied)
| Time (s) | Frequency (Hz) | Intensity (Color) |
|----------|----------------|-------------------|
| 0–15 | 0–30 | Blue |
| 15–25 | ~10 | Blue → Yellow |
| 25–75 | 0–30 | Blue |
| 75–85 | ~25 | Blue → Red |
| 85–120 | 0–30 | Blue |
## 8. Additional Notes
- **Language:** English (no non-English text detected).
- **Assumptions:**
- Color gradient follows standard spectrogram conventions due to absence of an explicit legend.
- No embedded text or hidden annotations present.