## 3D Surface Plot: True α - FE vs. x'1 and x'2
### Overview
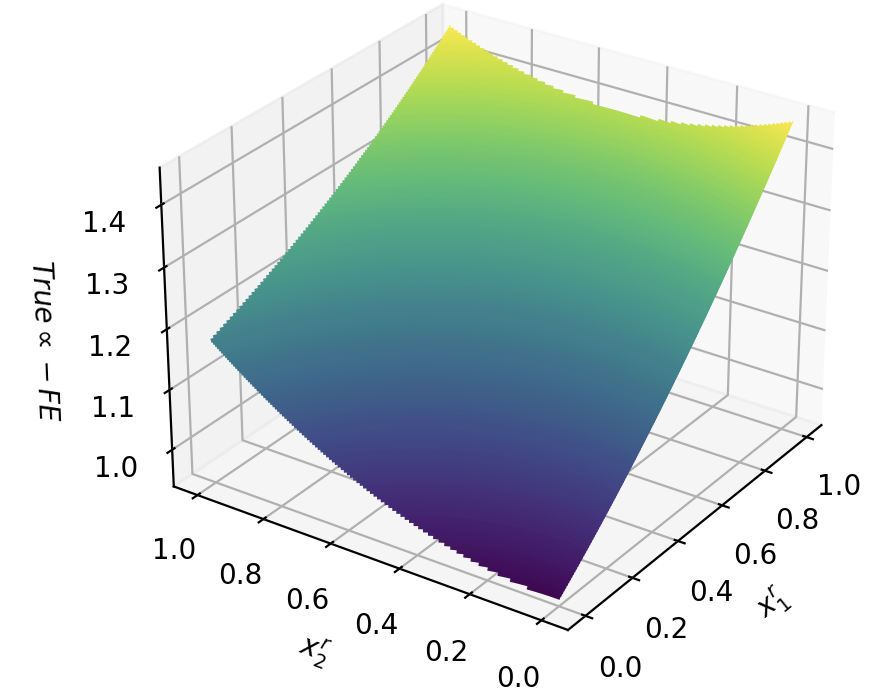
The image is a 3D surface plot visualizing the relationship between two independent variables, x'1 and x'2, and a dependent variable, True α - FE. The surface is colored according to the value of the dependent variable, ranging from a dark blue/purple at lower values to a yellow/green at higher values.
### Components/Axes
* **X-axis (x'1):** Ranges from 0.0 to 1.0 in increments of 0.2.
* **Y-axis (x'2):** Ranges from 0.0 to 1.0 in increments of 0.2.
* **Z-axis (True α - FE):** Ranges from 1.0 to 1.4 in increments of 0.1.
### Detailed Analysis
The surface plot shows how the value of "True α - FE" changes as x'1 and x'2 vary.
* **Trend:** The surface generally slopes upwards from the bottom-left corner (where x'1 and x'2 are both near 0) to the top-right corner (where x'1 and x'2 are both near 1). This indicates a positive correlation between "True α - FE" and both x'1 and x'2.
* **Specific Values:**
* When x'1 = 0 and x'2 = 0, True α - FE ≈ 1.0.
* When x'1 = 1 and x'2 = 0, True α - FE ≈ 1.2.
* When x'1 = 0 and x'2 = 1, True α - FE ≈ 1.2.
* When x'1 = 1 and x'2 = 1, True α - FE ≈ 1.4.
* **Color Gradient:** The color of the surface transitions from dark blue/purple at the lowest values of True α - FE to green and then yellow at the highest values.
### Key Observations
* The surface appears relatively smooth, suggesting a continuous relationship between the variables.
* The rate of change of "True α - FE" seems to be relatively consistent across the range of x'1 and x'2 values.
* The surface is slightly curved, indicating that the relationship between the variables might not be perfectly linear.
### Interpretation
The plot suggests that the value of "True α - FE" is influenced by both x'1 and x'2. Increasing either x'1 or x'2 tends to increase the value of "True α - FE". The specific nature of this relationship (linear vs. non-linear) would require further analysis, but the plot provides a clear visualization of the overall trend. The "True α - FE" value is lowest when both x'1 and x'2 are at their minimum values and highest when both are at their maximum values.