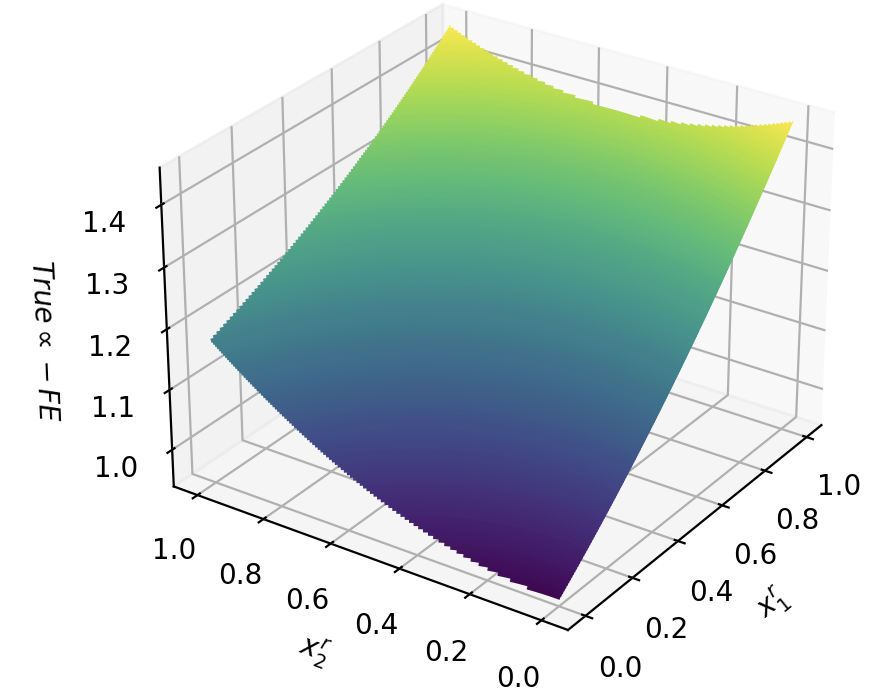
## 3D Surface Plot: True ∞ - FE vs. x₁ and x₂
### Overview
The image depicts a 3D surface plot representing the relationship between "True ∞ - FE" and two variables, x₁ and x₂. The surface is colored, indicating varying values of "True ∞ - FE". The plot is rendered in a perspective view, showing the surface extending from near zero to approximately 1.4 on the z-axis.
### Components/Axes
* **X-axis:** Labeled "x₁", ranging from 0.0 to 1.0, with markers at 0.2, 0.4, 0.6, 0.8.
* **Y-axis:** Labeled "x₂", ranging from 0.0 to 1.0, with markers at 0.2, 0.4, 0.6, 0.8.
* **Z-axis:** Labeled "True ∞ - FE", ranging from approximately 1.0 to 1.4, with markers at 1.0, 1.1, 1.2, 1.3, 1.4.
* **Surface:** The surface itself represents the function being plotted. The color gradient ranges from dark purple (low values of "True ∞ - FE") to light green/yellow (high values of "True ∞ - FE").
* **Grid:** A grid is visible on the x-y plane, providing a visual reference for the values of x₁ and x₂.
### Detailed Analysis
The surface exhibits a clear upward trend as both x₁ and x₂ increase.
* **Trend along x₁:** For a constant value of x₂, the surface slopes upward as x₁ increases.
* **Trend along x₂:** For a constant value of x₁, the surface slopes upward as x₂ increases.
* **Combined Trend:** The steepest increase in "True ∞ - FE" occurs when both x₁ and x₂ are increasing simultaneously.
Approximate data points (estimated from visual inspection):
* When x₁ = 0.0 and x₂ = 0.0, "True ∞ - FE" ≈ 1.0.
* When x₁ = 1.0 and x₂ = 0.0, "True ∞ - FE" ≈ 1.2.
* When x₁ = 0.0 and x₂ = 1.0, "True ∞ - FE" ≈ 1.2.
* When x₁ = 1.0 and x₂ = 1.0, "True ∞ - FE" ≈ 1.4.
* When x₁ = 0.5 and x₂ = 0.5, "True ∞ - FE" ≈ 1.15.
The surface appears to be relatively smooth, with no sharp discontinuities or sudden changes in slope. The color gradient is consistent, with darker shades representing lower values and lighter shades representing higher values.
### Key Observations
* The surface is convex, indicating a positive correlation between x₁ and x₂, and "True ∞ - FE".
* The rate of increase in "True ∞ - FE" is not constant; it appears to accelerate as x₁ and x₂ approach 1.0.
* The minimum value of "True ∞ - FE" is approximately 1.0, occurring at x₁ = 0.0 and x₂ = 0.0.
* The maximum value of "True ∞ - FE" is approximately 1.4, occurring at x₁ = 1.0 and x₂ = 1.0.
### Interpretation
The plot suggests a functional relationship where "True ∞ - FE" increases with increasing values of both x₁ and x₂. This could represent a model where "True ∞ - FE" is a combined function of x₁ and x₂, potentially representing some form of efficiency or performance metric. The convex shape of the surface indicates diminishing returns; while increasing both x₁ and x₂ always increases "True ∞ - FE", the rate of increase slows down as the values approach 1.0.
The label "True ∞ - FE" is unusual. The "∞" symbol suggests a limit or asymptotic behavior, but the plot shows finite values. "FE" could stand for "Finite Element" or "Front End", but without further context, the meaning remains ambiguous. The plot likely represents a simplified model or a specific region of a more complex function, where the values of x₁ and x₂ are constrained between 0.0 and 1.0. The plot could be used to optimize the values of x₁ and x₂ to maximize "True ∞ - FE", subject to any constraints on the variables.