## Line Graph: Average Speed vs. Number of Accelerators
### Overview
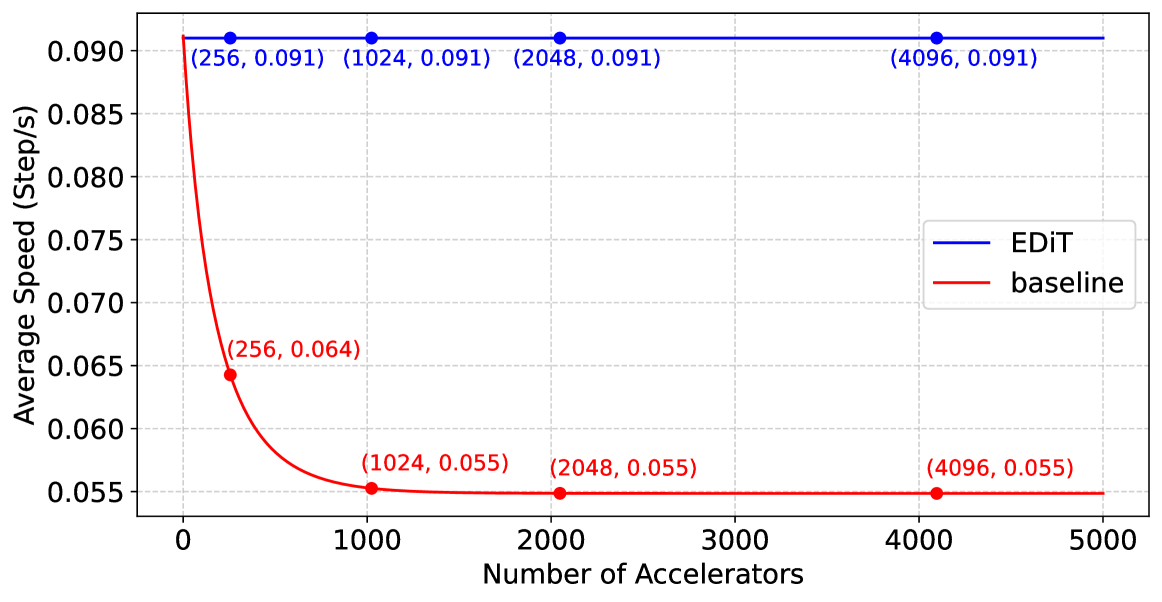
The graph compares two data series—**EDiT** (blue line) and **baseline** (red line)—across varying numbers of accelerators (0 to 5,000). The y-axis represents average speed in steps per second (Step/s), while the x-axis represents the number of accelerators. The EDiT line remains constant at 0.091 Step/s, while the baseline line declines sharply before plateauing.
### Components/Axes
- **X-axis**: "Number of Accelerators" (0 to 5,000, linear scale).
- **Y-axis**: "Average Speed (Step/s)" (0.055 to 0.090, linear scale).
- **Legend**: Located in the top-right corner, with:
- **Blue**: EDiT (constant speed).
- **Red**: Baseline (declining speed).
- **Data Points**:
- **EDiT**: (256, 0.091), (1024, 0.091), (2048, 0.091), (4096, 0.091).
- **Baseline**: (0, 0.090), (256, 0.064), (1024, 0.055), (2048, 0.055), (4096, 0.055).
### Detailed Analysis
- **EDiT Line**:
- Flat and horizontal at **0.091 Step/s** across all accelerator counts.
- No variation observed, indicating consistent performance regardless of accelerator quantity.
- **Baseline Line**:
- Starts at **0.090 Step/s** (at 0 accelerators).
- Drops sharply to **0.064 Step/s** at 256 accelerators.
- Further declines to **0.055 Step/s** at 1024 accelerators and remains constant thereafter.
- The steepest decline occurs between 0 and 256 accelerators.
### Key Observations
1. **EDiT Superiority**: EDiT maintains a significantly higher speed (0.091 Step/s) compared to the baseline (0.055–0.064 Step/s) across all accelerator counts.
2. **Baseline Degradation**: The baseline’s speed drops by **29%** (from 0.090 to 0.064) when accelerators increase from 0 to 256, then stabilizes at 0.055 Step/s beyond 1024 accelerators.
3. **Scalability**: EDiT shows no performance degradation with increased accelerators, while the baseline’s performance plateaus after 1024 accelerators.
### Interpretation
The graph demonstrates that **EDiT outperforms the baseline in scalability and efficiency**. The baseline’s sharp decline suggests diminishing returns or potential bottlenecks when using more accelerators, whereas EDiT’s constant speed implies optimized resource utilization. The plateau in the baseline’s performance at 0.055 Step/s (after 1024 accelerators) indicates a hard limit to its scalability, contrasting with EDiT’s linear scalability. This could imply architectural advantages in EDiT’s design, such as parallelization efficiency or reduced overhead.