# Technical Document Extraction: AIME-25 Diversity Analysis
## Chart Overview
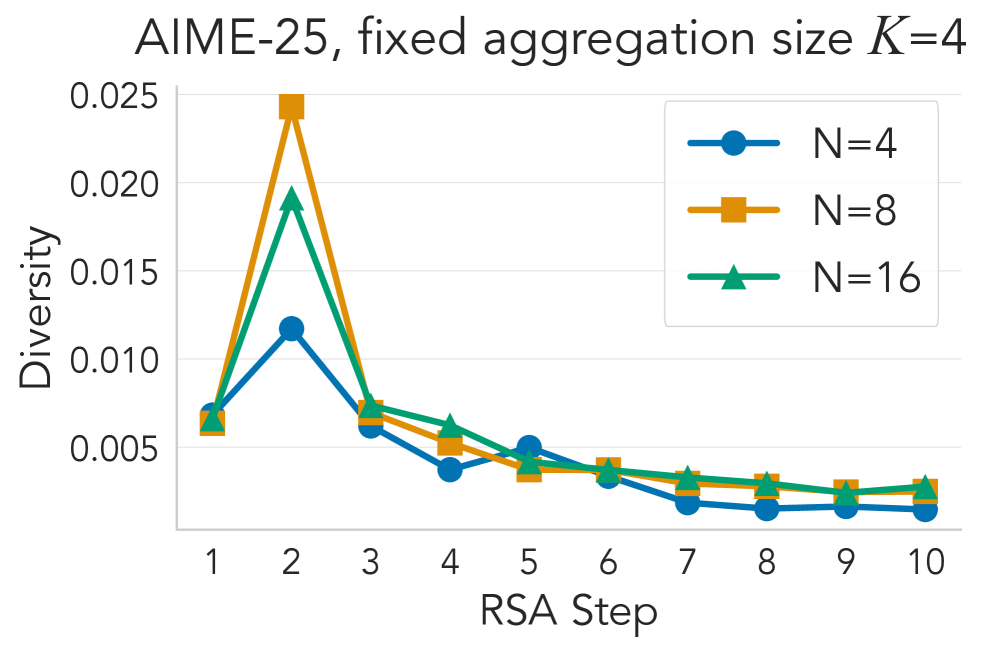
**Title**: AIME-25, fixed aggregation size K=4
**Type**: Line chart with markers
**Purpose**: Visualizes diversity metrics across RSA steps for different population sizes (N=4, N=8, N=16).
---
## Axis Labels and Scales
- **X-axis**:
- Label: "RSA Step"
- Range: 1 to 10 (integer increments)
- Ticks: 1, 2, 3, ..., 10
- **Y-axis**:
- Label: "Diversity"
- Range: 0.005 to 0.025
- Increment: 0.005
---
## Legend
- **Location**: Upper-right corner
- **Entries**:
1. **Blue circles**: N=4
2. **Orange squares**: N=8
3. **Green triangles**: N=16
---
## Data Series Analysis
### N=4 (Blue Circles)
- **Trend**:
- Starts at ~0.006 (step 1).
- Peaks at **0.012** (step 2).
- Declines steadily to ~0.002 (step 10).
- **Key Points**:
- Step 1: 0.006
- Step 2: 0.012
- Step 3: 0.006
- Step 4: 0.004
- Step 5: 0.005
- Step 6: 0.004
- Step 7: 0.003
- Step 8: 0.003
- Step 9: 0.003
- Step 10: 0.002
### N=8 (Orange Squares)
- **Trend**:
- Starts at ~0.006 (step 1).
- Peaks sharply at **0.025** (step 2).
- Drops rapidly to ~0.003 (step 10).
- **Key Points**:
- Step 1: 0.006
- Step 2: 0.025
- Step 3: 0.007
- Step 4: 0.006
- Step 5: 0.004
- Step 6: 0.004
- Step 7: 0.003
- Step 8: 0.003
- Step 9: 0.003
- Step 10: 0.003
### N=16 (Green Triangles)
- **Trend**:
- Starts at ~0.006 (step 1).
- Peaks at **0.020** (step 2).
- Declines gradually to ~0.003 (step 10).
- **Key Points**:
- Step 1: 0.006
- Step 2: 0.020
- Step 3: 0.007
- Step 4: 0.006
- Step 5: 0.005
- Step 6: 0.004
- Step 7: 0.004
- Step 8: 0.003
- Step 9: 0.003
- Step 10: 0.003
---
## Cross-Series Observations
1. **Peak at Step 2**:
- All series peak at RSA step 2, with N=8 showing the highest diversity (0.025).
2. **Post-Peak Divergence**:
- N=8 declines most sharply after step 2.
- N=16 maintains higher diversity than N=4 after step 2.
3. **Convergence**:
- By step 10, all series converge to ~0.003 diversity.
---
## Spatial Grounding
- **Legend Position**: Upper-right corner (coordinates: [x=0.85, y=0.85] relative to chart bounds).
- **Color-Symbol Consistency**:
- Blue circles (N=4) match all blue data points.
- Orange squares (N=8) match all orange data points.
- Green triangles (N=16) match all green data points.
---
## Final Notes
- **Language**: All text is in English.
- **Data Completeness**: All axis labels, legends, and data points are explicitly labeled.
- **No Missing Information**: No unreadable text or omitted labels.