## Flowchart: Conditional Algorithm Execution Flow
### Overview
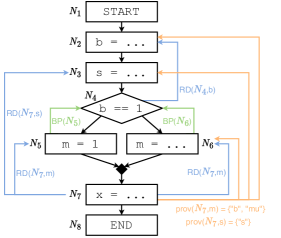
The image depicts a flowchart representing a conditional algorithm with variable assignments, decision points, and branching logic. The flow progresses from a START node (N₁) to an END node (N₈), with intermediate nodes (N₂–N₇) containing assignments, comparisons, and conditional branches. Arrows are color-coded (blue, orange, green) to denote different types of relationships (e.g., dependencies, branches).
---
### Components/Axes
- **Nodes (N₁–N₈)**:
- N₁: `START`
- N₂: `b = ...`
- N₃: `s = ...`
- N₄: Decision diamond (`b == 1`)
- N₅: `m = 1`
- N₆: `m = ...`
- N₇: `x = ...`
- N₈: `END`
- **Arrows**:
- **Blue**: Labeled `RD(Nₓ, y)` (e.g., `RD(N₄, b)`, `RD(N₇, m)`), likely indicating "Read" dependencies.
- **Orange**: Labeled `prov(Nₓ, y)` (e.g., `prov(N₇, m) = {"b", "mu"}`), possibly denoting "provenance" or output dependencies.
- **Green**: Labeled `BP(Nₓ)` (e.g., `BP(N₅)`, `BP(N₆)`), marking "Branch Points."
- **Legend**:
- Blue: Read dependencies
- Orange: Provenance/output dependencies
- Green: Branch points
---
### Detailed Analysis
1. **Initialization**:
- Nodes N₂ (`b = ...`) and N₃ (`s = ...`) initialize variables `b` and `s`.
- Arrows from N₂/N₃ to N₄ are blue (`RD`), suggesting dependencies on prior values.
2. **Decision Point (N₄)**:
- The diamond `b == 1` splits the flow into two branches:
- **True Path**: Green arrow to N₅ (`m = 1`).
- **False Path**: Green arrow to N₆ (`m = ...`).
3. **Convergence**:
- Both branches (N₅ and N₆) converge at N₇ (`x = ...`) via blue arrows (`RD(N₇, m)`), indicating `x` depends on `m`.
- N₇ outputs `x` with orange arrows (`prov(N₇, m) = {"b", "mu"}`), linking `x` to variables `b` and `mu`.
4. **Termination**:
- Flow ends at N₈ (`END`).
---
### Key Observations
- **Conditional Logic**: The decision at N₄ (`b == 1`) determines whether `m` is set to `1` (N₅) or an unspecified value (N₆).
- **Data Dependencies**: Blue arrows (`RD`) enforce strict dependencies (e.g., `x` depends on `m`).
- **Provenance Tracking**: Orange arrows (`prov`) track variable origins (e.g., `x` derives from `b` and `mu`).
- **Branch Points**: Green arrows (`BP`) highlight critical decision nodes (N₅ and N₆).
---
### Interpretation
This flowchart models a **conditional algorithm** where:
1. Variables `b` and `s` are initialized, then used to evaluate `b == 1`.
2. The outcome of this evaluation dictates the value of `m`, which in turn determines `x`.
3. The use of `RD` and `prov` labels suggests a focus on **data provenance** and **dependency tracking**, critical in systems requiring auditability (e.g., scientific computing, formal verification).
4. The convergence at N₇ implies that `x` synthesizes results from both branches, possibly representing a unified output regardless of the conditional path.
**Notable Patterns**:
- The algorithm prioritizes deterministic outcomes (`m = 1` or `m = ...`) before computing `x`.
- The absence of explicit values for `b`, `s`, and `m` in N₂/N₃/N₆ suggests placeholders for dynamic inputs or iterative processes.
**Underlying Logic**:
- The flowchart emphasizes **control flow** (via branches) and **data lineage** (via `RD`/`prov`), typical in systems where reproducibility and traceability are paramount.