## Flowchart Diagram: Algorithmic Process Flow with Conditional Branching
### Overview
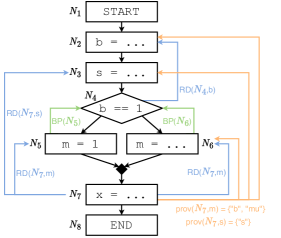
The image displays a vertical flowchart diagram representing an algorithmic or computational process. The flowchart consists of eight rectangular nodes (labeled N1 through N8) connected by directional arrows, indicating the sequence of operations. The process includes a conditional decision point (N4) that creates two distinct branches, which later converge. The diagram uses color-coded arrows (orange and blue) to differentiate between two proof or validation paths, as indicated by a legend in the bottom-right corner.
### Components/Axes
* **Nodes (Process Steps):** Eight rectangular boxes, each labeled with an identifier (N1 to N8) and containing a brief instruction or variable assignment.
* **Flow Arrows:** Directional lines connecting the nodes. They are primarily black, but two specific paths are highlighted in orange and blue.
* **Legend:** Located in the bottom-right quadrant. It defines the meaning of the colored arrows:
* Orange line: `prov(N7, m) = "T"`
* Blue line: `prov(N7, m) = "F"`
* **Spatial Layout:** The flowchart is arranged vertically from top (N1: START) to bottom (N8: END). The conditional branch at N4 creates a horizontal split, with the left path (blue arrow) leading to N5 and the right path (orange arrow) leading to N6. The legend is positioned to the right of the main flow, adjacent to the converging paths from N5 and N6.
### Detailed Analysis
**Node-by-Node Content:**
* **N1 (Top):** `START`
* **N2:** `b = ...` (An initialization or assignment for variable `b`)
* **N3:** `s = ...` (An initialization or assignment for variable `s`)
* **N4 (Decision):** `b = 1` (A conditional check. Two arrows exit this node):
* **Left (Blue Arrow):** Labeled `RD(N7, b)`. Leads to node N5.
* **Right (Orange Arrow):** Labeled `RD(N7, b)`. Leads to node N6.
* **N5 (Left Branch):** `m = 1`
* **N6 (Right Branch):** `m = ...` (An assignment for variable `m`)
* **Convergence Point:** Arrows from N5 and N6 merge before entering N7.
* **N7:** `x = ...` (An assignment for variable `x`)
* **N8 (Bottom):** `END`
**Arrow Labels and Paths:**
* A **blue arrow** originates from the left side of N7, loops back upwards, and points to the left side of N2. It is labeled `RD(N7, b)`.
* An **orange arrow** originates from the right side of N7, loops back upwards, and points to the right side of N2. It is labeled `RD(N7, b)`.
* The legend clarifies that the **blue path** (from the left branch at N4 through N5) corresponds to the condition `prov(N7, m) = "F"` (False).
* The legend clarifies that the **orange path** (from the right branch at N4 through N6) corresponds to the condition `prov(N7, m) = "T"` (True).
### Key Observations
1. **Conditional Logic:** The core of the process is the decision at N4 (`b = 1`). The outcome of this check determines whether the process follows the left path (setting `m = 1`) or the right path (setting `m = ...`).
2. **Looping Structure:** The process contains a loop. After executing N7 (`x = ...`), control flow returns to N2 (`b = ...`) via either the blue or orange feedback arrow, suggesting an iterative process.
3. **Color-Coded Proof States:** The diagram explicitly links the choice of branch (left/right at N4) to a resulting proof state (`prov(N7, m)`) for variable `m`. The left branch leads to a "False" proof state, and the right branch leads to a "True" proof state.
4. **Ambiguous Assignments:** Several nodes (N2, N3, N6, N7) contain ellipses (`...`), indicating that the specific values or expressions assigned to variables `b`, `s`, `m`, and `x` are not defined in this diagram. They are placeholders for operations to be specified elsewhere.
### Interpretation
This flowchart models a **conditional iterative algorithm** where the internal state (specifically the value of `b`) determines the computational path taken in each loop iteration. The key investigative insight is the relationship between the conditional check (`b = 1`), the assignment to `m`, and the resulting "proof" value `prov(N7, m)`.
The diagram suggests that:
* The system is designed to test a condition (`b = 1`).
* Based on the test, it sets `m` to a specific value (`1` or another value).
* This choice of `m` later results in a verifiable outcome (`"T"` or `"F"`) at the stage represented by N7.
* The process then repeats, using updated values for `b` and `s`.
The presence of the `prov` function and the `RD` labels (which may stand for "Read" or "Reduction") implies this could be a diagram from formal methods, program verification, or a logical proof system, where the flowchart tracks both the execution of an algorithm and the state of a corresponding proof or validation condition. The loop indicates the algorithm may run until a certain condition is met, with the proof state being tracked across iterations.