# Technical Document Extraction: Layer Accuracy Analysis
## Overview
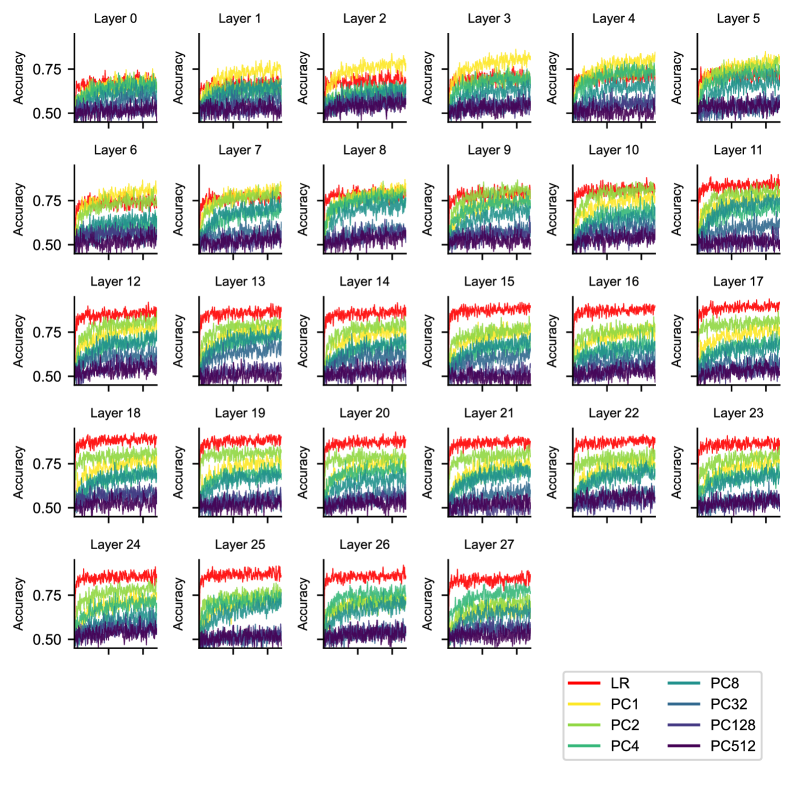
The image presents a grid of 28 line charts (Layers 0–27), each visualizing accuracy metrics across multiple computational components. Charts are organized in rows of 6 columns (except the final row, which contains 4 charts). Each chart shares identical axis labels and legend structure.
---
## Axis Labels
- **Y-Axis**: "Accuracy" (range: 0.5 to 0.75)
- **X-Axis**: "Layer" (categorical, 0–27)
---
## Legend
Color-coded labels for computational components:
| Color | Label |
|-------------|---------|
| Red | LR |
| Teal | PC8 |
| Yellow | PC1 |
| Dark Blue | PC32 |
| Green | PC2 |
| Purple | PC128 |
| Light Blue | PC4 |
| Dark Purple | PC512 |
---
## Layer Structure
- **Total Layers**: 28 (0–27)
- **Chart Format**: Line charts with overlapping colored lines
- **Layer Grouping**:
- Rows 1–4: 6 layers per row (Layers 0–5, 6–11, 12–17, 18–23)
- Row 5: 4 layers (Layers 24–27)
---
## Key Trends
1. **General Accuracy Progression**:
- Accuracy values generally increase with layer depth (bottom-to-top in charts).
- Baseline accuracy starts near 0.5 for all components in early layers (0–5).
- By Layer 27, most components approach 0.75 accuracy.
2. **Component-Specific Patterns**:
- **LR (Red)**: Consistently highest accuracy across most layers, with gradual improvement.
- **PC8 (Teal)**: Shows moderate growth, often plateauing mid-chart.
- **PC1 (Yellow)**: Rapid initial gains in early layers, followed by stabilization.
- **PC32 (Dark Blue)**: Steady but slower improvement compared to other components.
- **PC2 (Green)**: Fluctuates significantly in mid-layers (10–15), then stabilizes.
- **PC128 (Purple)**: Sharp rise in later layers (20–27), surpassing some components.
- **PC4 (Light Blue)**: Moderate growth with occasional dips.
- **PC512 (Dark Purple)**: Lowest accuracy in early layers but shows exponential growth post-Layer 15.
3. **Layer-Specific Observations**:
- **Layers 0–5**: All components start near 0.5 accuracy; LR and PC1 diverge first.
- **Layers 10–15**: PC2 exhibits volatility; PC128 begins rapid ascent.
- **Layers 20–27**: PC128 and PC512 outperform others, with PC512 closing the gap.
---
## Data Consistency
- **Legend-Line Matching**: All colors in the legend correspond precisely to line colors in every chart.
- **Axis Uniformity**: Y-axis range (0.5–0.75) and X-axis labels (Layer 0–27) are consistent across all charts.
---
## Summary
The visualization demonstrates how different computational components (LR, PC8, PC1, etc.) contribute to accuracy across 28 neural network layers. LR and PC128 show the most significant improvement, while PC512 emerges as a strong performer in later layers. Accuracy trends suggest deeper layers (20–27) achieve higher performance, with component-specific optimization opportunities identified in mid-layers (10–15).