## Line Chart: Model Comparison (Avg. Acc. ±Std over 5 Runs)
### Overview
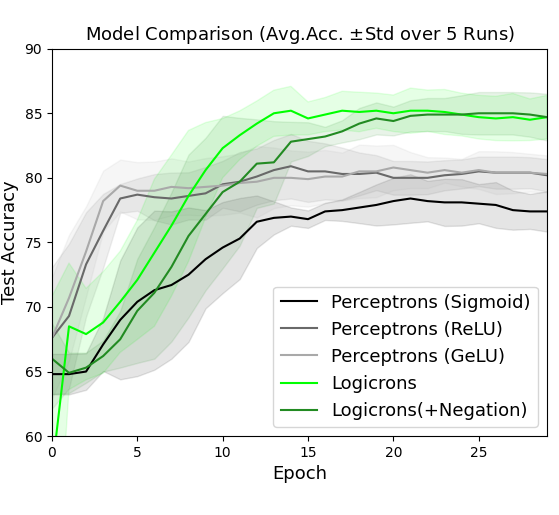
The image is a line chart comparing the test accuracy of five different models over 28 epochs. The chart displays the average accuracy and standard deviation over 5 runs for each model. The models being compared are Perceptrons with Sigmoid, ReLU, and GeLU activation functions, as well as Logicrons and Logicrons with Negation.
### Components/Axes
* **Title:** Model Comparison (Avg. Acc. ±Std over 5 Runs)
* **X-axis:** Epoch, with ticks at 0, 5, 10, 15, 20, and 25.
* **Y-axis:** Test Accuracy, ranging from 60 to 90, with ticks at 60, 65, 70, 75, 80, 85, and 90.
* **Legend:** Located in the bottom-right corner, it identifies each model by color:
* Black: Perceptrons (Sigmoid)
* Dark Gray: Perceptrons (ReLU)
* Light Gray: Perceptrons (GeLU)
* Light Green: Logicrons
* Dark Green: Logicrons(+Negation)
* **Standard Deviation:** Each line has a shaded region around it, representing the standard deviation of the accuracy over the 5 runs.
### Detailed Analysis
* **Perceptrons (Sigmoid) - Black:**
* Trend: The line starts around 65% accuracy, increases rapidly until about epoch 10, reaching approximately 77%, and then plateaus with a slight increase to approximately 78% by epoch 28.
* Data Points:
* Epoch 0: ~65%
* Epoch 10: ~77%
* Epoch 28: ~78%
* **Perceptrons (ReLU) - Dark Gray:**
* Trend: The line starts around 68% accuracy, increases rapidly until about epoch 5, reaching approximately 80%, and then plateaus with a slight increase to approximately 81% by epoch 28.
* Data Points:
* Epoch 0: ~68%
* Epoch 5: ~80%
* Epoch 28: ~81%
* **Perceptrons (GeLU) - Light Gray:**
* Trend: The line starts around 65% accuracy, increases rapidly until about epoch 5, reaching approximately 80%, and then plateaus with a slight increase to approximately 82% by epoch 28.
* Data Points:
* Epoch 0: ~65%
* Epoch 5: ~80%
* Epoch 28: ~82%
* **Logicrons - Light Green:**
* Trend: The line starts around 60% accuracy, increases rapidly until about epoch 15, reaching approximately 85%, and then plateaus with a slight decrease to approximately 84% by epoch 28.
* Data Points:
* Epoch 0: ~60%
* Epoch 15: ~85%
* Epoch 28: ~84%
* **Logicrons(+Negation) - Dark Green:**
* Trend: The line starts around 65% accuracy, increases rapidly until about epoch 15, reaching approximately 85%, and then plateaus with a slight decrease to approximately 84% by epoch 28.
* Data Points:
* Epoch 0: ~65%
* Epoch 15: ~85%
* Epoch 28: ~84%
### Key Observations
* The Logicrons models (both with and without negation) generally outperform the Perceptron models in terms of test accuracy.
* The Perceptron models with ReLU and GeLU activation functions perform similarly, and both outperform the Sigmoid activation function.
* All models show a rapid increase in accuracy in the initial epochs, followed by a plateau.
* The standard deviation (shaded region) appears to be relatively consistent across all models and epochs.
### Interpretation
The chart demonstrates the performance of different neural network models on a specific task, as measured by test accuracy over a series of training epochs. The Logicrons models appear to be more effective for this task compared to the Perceptron models. Among the Perceptron models, using ReLU or GeLU activation functions leads to better performance than using Sigmoid. The plateauing of accuracy suggests that the models may be reaching their maximum potential performance on this task, or that further training may require adjustments to the model architecture or training parameters. The standard deviation provides insight into the consistency of the model's performance across multiple runs, with relatively consistent standard deviations suggesting stable training.