## Line Chart: Model Comparison (Avg.Acc. ±Std over 5 Runs)
### Overview
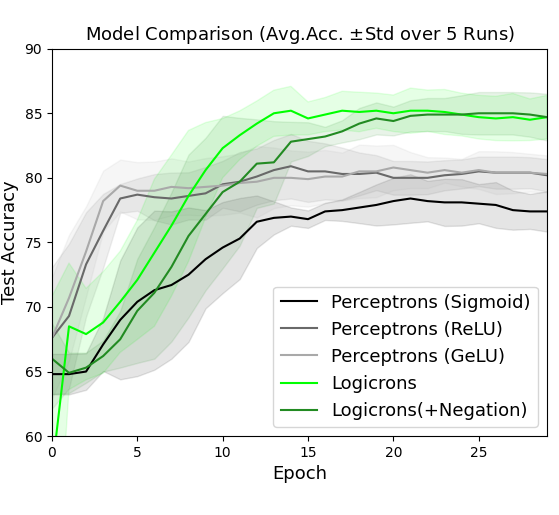
The image is a line chart comparing the test accuracy of five different machine learning models over 25 training epochs. The chart displays the average accuracy across 5 runs, with shaded regions representing the standard deviation for each model. The overall trend shows all models improving accuracy over time, with two distinct performance tiers emerging.
### Components/Axes
* **Title:** "Model Comparison (Avg.Acc. ±Std over 5 Runs)" located at the top center.
* **X-Axis:** Labeled "Epoch". The scale runs from 0 to 25, with major tick marks at intervals of 5 (0, 5, 10, 15, 20, 25).
* **Y-Axis:** Labeled "Test Accuracy". The scale runs from 60 to 90, with major tick marks at intervals of 5 (60, 65, 70, 75, 80, 85, 90).
* **Legend:** Located in the bottom-right quadrant of the chart area. It contains five entries, each with a colored line sample and a label:
1. **Black Line:** Perceptrons (Sigmoid)
2. **Dark Gray Line:** Perceptrons (ReLU)
3. **Light Gray Line:** Perceptrons (GeLU)
4. **Bright Green Line:** Logicrons
5. **Dark Green Line:** Logicrons(+Negation)
* **Data Series:** Five lines with associated shaded error bands (standard deviation regions).
### Detailed Analysis
**Trend Verification & Data Points (Approximate):**
* **Perceptrons (Sigmoid) - Black Line:** Starts at ~65 accuracy at epoch 0. Shows a steady, moderate upward slope, plateauing around epoch 15. Ends at approximately 77-78 accuracy at epoch 25. The standard deviation band is moderately wide throughout.
* **Perceptrons (ReLU) - Dark Gray Line:** Starts at ~65. Rises more steeply than the Sigmoid variant initially, crossing 75 accuracy by epoch 5. Plateaus around epoch 10-15. Ends at approximately 80-81 accuracy at epoch 25. Its error band is similar in width to the Sigmoid model.
* **Perceptrons (GeLU) - Light Gray Line:** Follows a nearly identical trajectory to the ReLU model. Starts at ~65, rises steeply, and plateaus at a very similar level, ending at approximately 80-81 accuracy at epoch 25. Its line and error band closely overlap with the ReLU model's.
* **Logicrons - Bright Green Line:** Starts the lowest, at ~60 accuracy at epoch 0. Exhibits the steepest initial learning curve, surpassing all Perceptron models by epoch 7-8. Reaches a high plateau around epoch 12-13. Ends at the highest accuracy, approximately 85, at epoch 25. The standard deviation band is notably wide in the early epochs (0-10), indicating high variance between runs, but narrows significantly as training progresses.
* **Logicrons(+Negation) - Dark Green Line:** Starts at ~65. Follows a similar steep ascent as the standard Logicrons model but maintains a slight lead throughout most of the training. It also plateaus around epoch 12-13 and ends at approximately 85 accuracy at epoch 25, virtually indistinguishable from the standard Logicrons model in the final epochs. Its error band is also wide early on and narrows later.
**Spatial Grounding:** The legend is positioned in the bottom-right, overlapping the lower portion of the error bands for the Perceptron models but not obscuring the primary trend lines. The two green Logicrons lines occupy the top portion of the chart from epoch 10 onward, while the three gray/black Perceptron lines form a distinct cluster below them.
### Key Observations
1. **Performance Tiers:** A clear separation occurs after epoch ~8. The two Logicrons variants form a high-performance tier (~85 accuracy), while the three Perceptron variants form a lower tier (~77-81 accuracy).
2. **Activation Function Impact:** Among Perceptrons, using ReLU or GeLU activation functions yields nearly identical and superior performance (~80-81) compared to the Sigmoid function (~77-78).
3. **Logicrons Advantage:** Both Logicrons models significantly outperform all Perceptron models in final accuracy.
4. **Negation Effect:** Adding "Negation" to the Logicrons model provides a minor, consistent accuracy boost during the learning phase (epochs 0-12), but the final converged performance is essentially the same as the standard Logicrons model.
5. **Variance Pattern:** All models show higher variance (wider error bands) during the initial learning phase (epochs 0-10). The variance decreases for all models as they converge, but remains slightly more pronounced for the Perceptron models even at plateau.
### Interpretation
The data suggests a fundamental architectural or algorithmic advantage of the "Logicrons" approach over standard Perceptron networks for this specific task, as evidenced by both a faster learning rate and a higher final accuracy ceiling. The near-identical performance of ReLU and GeLU activations indicates the task is not sensitive to the choice between these two modern activation functions, but is sensitive to the older Sigmoid function, which performs worse.
The high initial variance for Logicrons implies their learning process is more sensitive to initial conditions or data sampling in early epochs, but this instability resolves as training progresses. The negligible final difference between "Logicrons" and "Logicrons(+Negation)" suggests the negation component may aid in faster convergence or robustness during learning but does not increase the ultimate capacity of the model for this problem. The chart effectively demonstrates that model architecture (Logicrons vs. Perceptrons) is a more significant factor for final accuracy than the choice of activation function within the Perceptron family.