\n
## Line Chart: Sokoban Gridworld Adjusted Trap Rate
### Overview
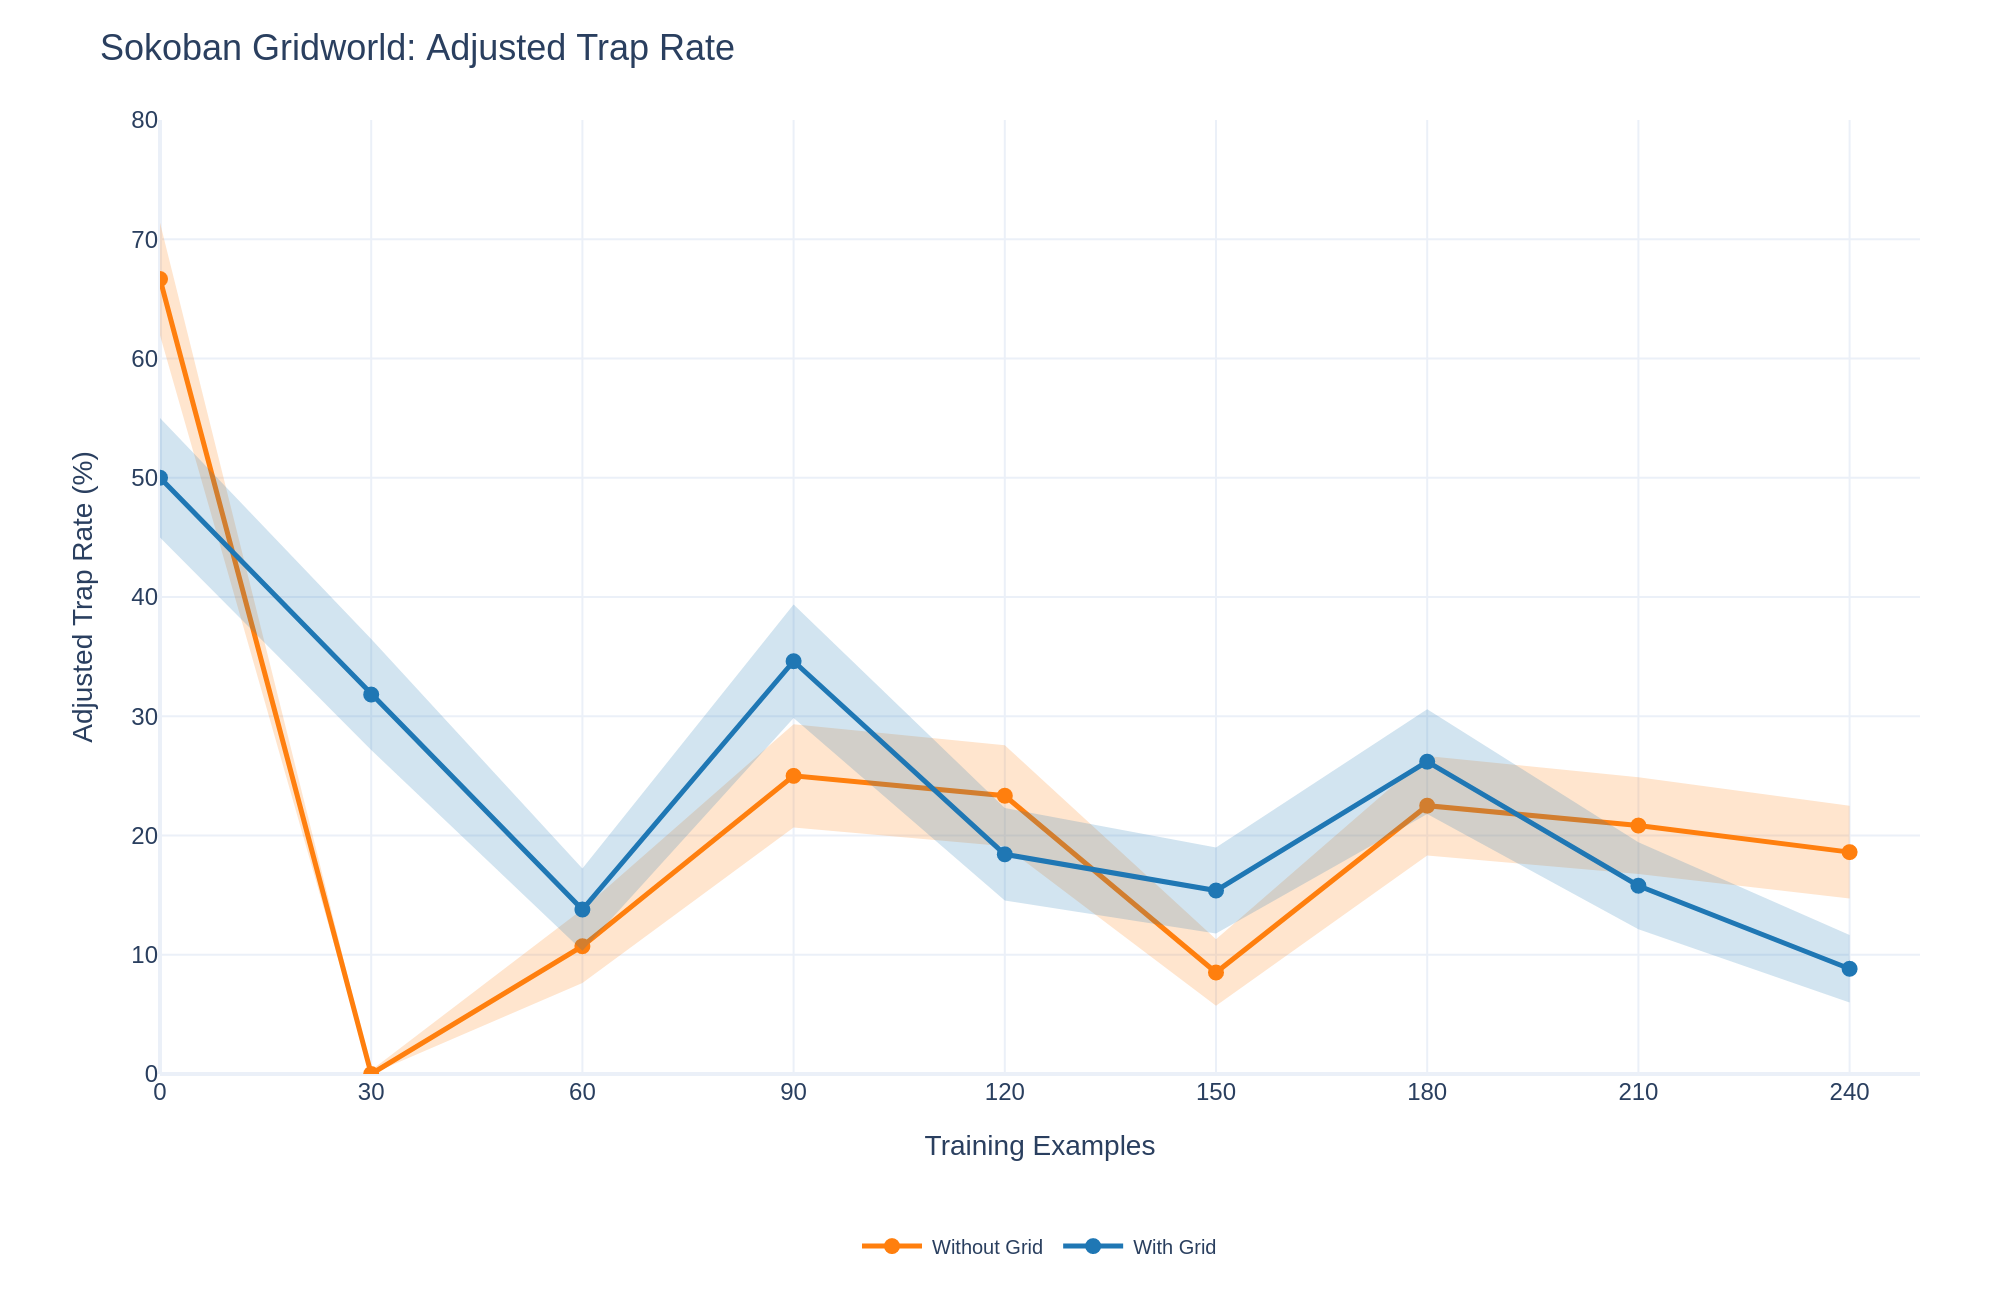
This line chart displays the adjusted trap rate (%) for two conditions – "With Grid" and "Without Grid" – as a function of the number of training examples. The chart shows the performance of a Sokoban Gridworld system as it is trained with increasing amounts of data. Shaded areas around each line represent uncertainty or variance in the data.
### Components/Axes
* **Title:** Sokoban Gridworld: Adjusted Trap Rate
* **X-axis:** Training Examples (ranging from 0 to 240, with markers at 30, 60, 90, 120, 150, 180, 210, and 240)
* **Y-axis:** Adjusted Trap Rate (%) (ranging from 0 to 80, with markers at 0, 10, 20, 30, 40, 50, 60, 70, and 80)
* **Legend:**
* "Without Grid" – Orange line
* "With Grid" – Blue line
* **Shaded Areas:** Light orange and light blue areas surrounding the respective lines, indicating variance.
### Detailed Analysis
The chart presents two lines representing the adjusted trap rate for "With Grid" and "Without Grid" conditions across varying training examples.
**"Without Grid" (Orange Line):**
The line starts at approximately 48% at 0 training examples. It then sharply declines to around 10% at 30 training examples. It fluctuates between approximately 10% and 30% for the remainder of the training examples, with a peak around 32% at 90 training examples, a dip to approximately 11% at 150 training examples, and ending at approximately 17% at 240 training examples.
**"With Grid" (Blue Line):**
The line begins at approximately 50% at 0 training examples. It rapidly decreases to around 5% at 30 training examples. It then rises to approximately 33% at 90 training examples, falls to around 10% at 150 training examples, rises again to approximately 25% at 180 training examples, and finally declines to approximately 10% at 240 training examples.
The shaded areas around each line indicate the variance in the data. The "Without Grid" shaded area is generally wider than the "With Grid" shaded area, suggesting greater variability in the "Without Grid" condition.
### Key Observations
* Both conditions exhibit a significant decrease in adjusted trap rate with increasing training examples.
* The "With Grid" condition initially shows a lower trap rate than the "Without Grid" condition, but the lines cross around 60 training examples.
* The "With Grid" condition demonstrates more fluctuation in trap rate as training progresses, with a notable peak around 90 training examples.
* The "Without Grid" condition shows a more stable, though still fluctuating, trap rate after the initial decline.
* The shaded areas suggest that the "Without Grid" condition has more variance in its trap rate than the "With Grid" condition.
### Interpretation
The data suggests that both the presence and absence of a grid in the Sokoban Gridworld environment lead to improved performance (lower trap rate) with increased training. Initially, the grid seems to provide a more significant advantage, but as training progresses, the "Without Grid" condition catches up. The fluctuations in the "With Grid" condition might indicate that the grid introduces complexities that require more training to overcome, or that the grid's benefits are more sensitive to the specific training examples. The wider variance in the "Without Grid" condition suggests that the system's performance is more unpredictable in that environment. The initial high trap rates for both conditions indicate that the system starts with a poor understanding of the environment, and learning is crucial for improving performance. The convergence of the lines towards the end of the training period suggests that both conditions are approaching a similar level of performance, although the "Without Grid" condition still exhibits more variability.