## Bar Chart: Test Accuracy vs. Dropout Rate
### Overview
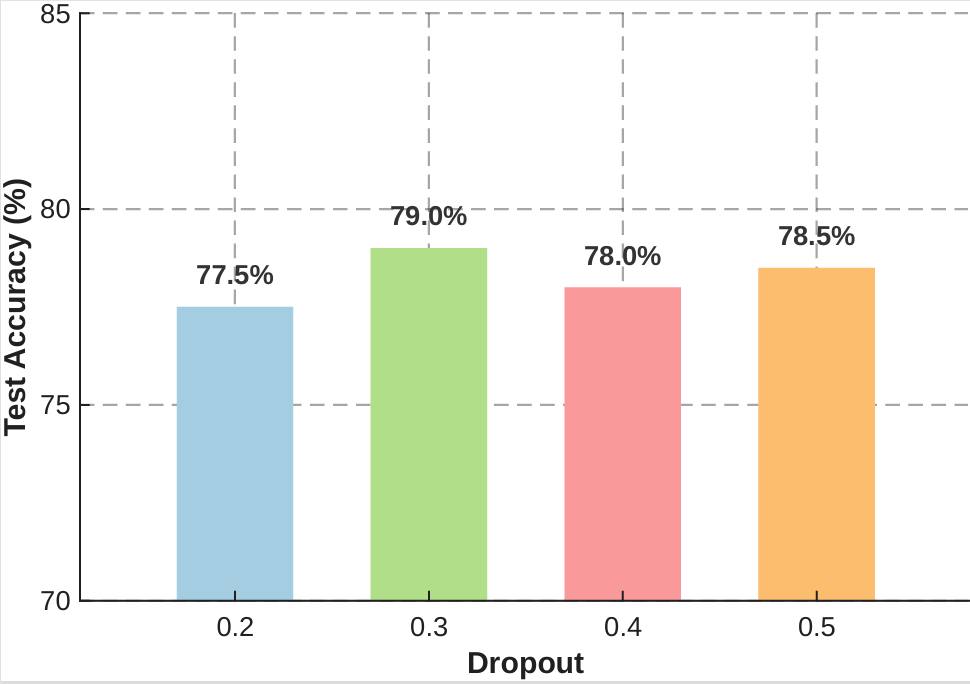
The image is a bar chart illustrating the performance of a machine learning model (likely a neural network) across four different dropout regularization rates. The chart plots "Dropout" values on the horizontal axis against "Test Accuracy (%)" on the vertical axis.
### Components/Axes
* **Y-Axis (Vertical):** Labeled "Test Accuracy (%)". The scale ranges from 70 to 85, with dashed horizontal grid lines at intervals of 5 units (70, 75, 80, 85).
* **X-Axis (Horizontal):** Labeled "Dropout". The axis displays four discrete categories: 0.2, 0.3, 0.4, and 0.5.
* **Data Series:** Four vertical bars, each color-coded and labeled with its specific percentage value at the top.
### Detailed Analysis
The chart displays four distinct data points. Below is the extraction of values, cross-referenced by color and position:
* **Dropout 0.2 (Blue Bar):**
* **Position:** Far left.
* **Value:** 77.5%
* **Trend:** Baseline starting point.
* **Dropout 0.3 (Green Bar):**
* **Position:** Second from left.
* **Value:** 79.0%
* **Trend:** The bar height increases significantly compared to the 0.2 bar, representing the peak accuracy in this dataset.
* **Dropout 0.4 (Red/Pink Bar):**
* **Position:** Third from left.
* **Value:** 78.0%
* **Trend:** The bar height decreases compared to the 0.3 bar.
* **Dropout 0.5 (Orange Bar):**
* **Position:** Far right.
* **Value:** 78.5%
* **Trend:** The bar height increases slightly compared to the 0.4 bar, though it remains lower than the 0.3 peak.
### Key Observations
* **Optimal Performance:** The highest test accuracy is achieved at a dropout rate of 0.3 (79.0%).
* **Non-Linear Trend:** The relationship between dropout and accuracy is not monotonic. Accuracy increases from 0.2 to 0.3, drops at 0.4, and then experiences a slight recovery at 0.5.
* **Range:** The total variance in test accuracy across all tested dropout rates is 1.5% (ranging from 77.5% to 79.0%).
### Interpretation
This chart demonstrates the sensitivity of a model to the dropout hyperparameter, which is used to prevent overfitting by randomly setting a fraction of input units to 0 during training.
* **Optimal Hyperparameter:** The data suggests that a dropout rate of 0.3 is the optimal setting among those tested.
* **Underfitting vs. Overfitting:** The drop in accuracy at 0.4 suggests that increasing the dropout rate beyond 0.3 may be causing the model to lose too much information (underfitting), thereby reducing its predictive capability.
* **Anomalous Recovery:** The slight increase in accuracy at 0.5 (compared to 0.4) is an interesting anomaly. In a typical regularization curve, one might expect a steady decline after the optimal point. This recovery could indicate that the model architecture is robust enough to handle higher dropout, or it could be a result of stochastic variance in the training process.
* **Conclusion:** For this specific model, a dropout rate of 0.3 provides the best balance between regularization and information retention.