## Scatter Plot: GFLOPS vs. Date for Different DNN Models and Token Sizes
### Overview
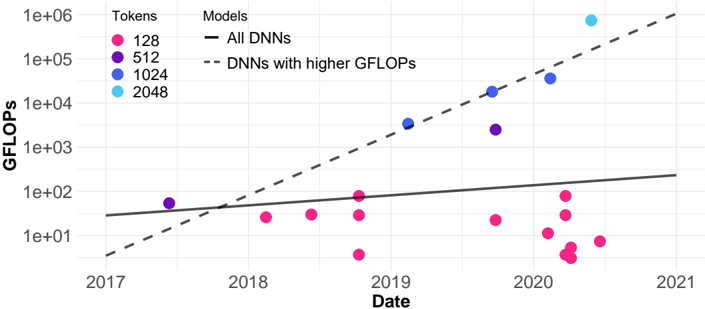
The image is a scatter plot showing the relationship between GFLOPS (floating point operations per second) and date for different deep neural network (DNN) models, categorized by token size. The plot includes trend lines for "All DNNs" and "DNNs with higher GFLOPS."
### Components/Axes
* **X-axis:** Date, ranging from 2017 to 2021.
* **Y-axis:** GFLOPS, on a logarithmic scale from 1e+01 (10) to 1e+06 (1,000,000).
* **Legend (Top-Left):**
* **Tokens:**
* Pink: 128
* Purple: 512
* Blue: 1024
* Light Blue: 2048
* **Models:**
* Solid Black Line: All DNNs
* Dashed Black Line: DNNs with higher GFLOPs
### Detailed Analysis
* **All DNNs (Solid Black Line):** This line shows a slight upward trend.
* Approximate GFLOPS in 2017: 50
* Approximate GFLOPS in 2021: 200
* **DNNs with higher GFLOPs (Dashed Black Line):** This line shows a significant upward trend.
* Approximate GFLOPS in 2017: 2
* Approximate GFLOPS in 2021: 500,000
* **Token Size 128 (Pink):** The data points are clustered around the GFLOPS range of 10 to 100, primarily in 2020.
* 2018: ~30 GFLOPS
* 2019: ~30 GFLOPS
* 2020: Multiple points between ~2 and ~100 GFLOPS
* **Token Size 512 (Purple):** There are two data points.
* 2017: ~60 GFLOPS
* 2019: ~3000 GFLOPS
* **Token Size 1024 (Blue):** The data points show an upward trend.
* 2019: ~5000 GFLOPS
* 2020: ~20000 GFLOPS
* **Token Size 2048 (Light Blue):** There is one data point.
* 2020: ~800000 GFLOPS
### Key Observations
* GFLOPS generally increase with date for DNNs with higher GFLOPS.
* Token size appears to correlate with higher GFLOPS, with larger token sizes generally appearing higher on the plot.
* The "All DNNs" trend line shows a much slower increase in GFLOPS compared to "DNNs with higher GFLOPs."
* The majority of the 128 token data points are clustered in 2020, with relatively low GFLOPS.
### Interpretation
The plot suggests that DNNs with higher GFLOPS have experienced significant performance improvements over time. The token size also appears to play a role in GFLOPS, with larger token sizes associated with higher computational performance. The difference between the "All DNNs" and "DNNs with higher GFLOPs" trend lines indicates that a subset of DNNs is driving the overall increase in GFLOPS. The clustering of 128 token data points in 2020 with lower GFLOPS may indicate a focus on smaller, more efficient models during that period, or simply a larger number of models with that token size being developed. The single 2048 token data point in 2020 shows a very high GFLOPS, suggesting a significant leap in performance for models using that token size.