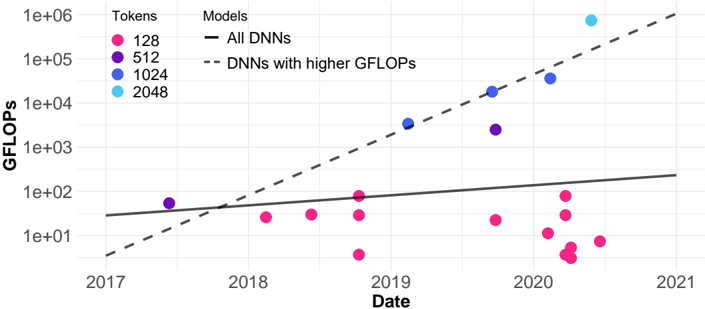
## Line Chart: GFLOPs vs. Date for Different Token Counts and DNN Models
### Overview
The chart visualizes the growth of GFLOPs (giga floating-point operations per second) over time (2017–2021) for deep neural networks (DNNs), with data points categorized by token counts (128, 512, 1024, 2048). Two trend lines are included: one for "All DNNs" (solid black) and another for "DNNs with higher GFLOPs" (dashed black). The y-axis uses a logarithmic scale (1e+01 to 1e+06), emphasizing exponential growth patterns.
### Components/Axes
- **X-axis (Date)**: Years 2017–2021, labeled at yearly intervals.
- **Y-axis (GFLOPs)**: Logarithmic scale from 1e+01 to 1e+06, with ticks at 1e+01, 1e+02, 1e+03, 1e+04, 1e+05, 1e+06.
- **Legend**:
- Solid black line: "All DNNs"
- Dashed black line: "DNNs with higher GFLOPs"
- **Data Points**:
- Pink dots: 128 tokens
- Purple dots: 512 tokens
- Blue dots: 1024 tokens
- Cyan dots: 2048 tokens
### Detailed Analysis
- **Trend Lines**:
- **Solid Line ("All DNNs")**: A nearly linear upward slope, starting near 1e+01 GFLOPs in 2017 and reaching ~1e+02 by 2021.
- **Dashed Line ("DNNs with higher GFLOPs")**: A steeper upward slope, starting near 1e+01 in 2017 and reaching ~1e+05 by 2021.
- **Data Points**:
- **128 Tokens (Pink)**: Scattered below the solid line, with values ranging from ~1e+01 (2017) to ~1e+02 (2021). Most points cluster between 1e+01 and 1e+02.
- **512 Tokens (Purple)**: Two points near the dashed line (~1e+02 in 2018 and ~1e+03 in 2020).
- **1024 Tokens (Blue)**: Three points aligned with the dashed line (~1e+03 in 2019, ~1e+04 in 2020, ~1e+05 in 2021).
- **2048 Tokens (Cyan)**: One point at ~1e+06 GFLOPs in 2021, far above all other data and trend lines.
### Key Observations
1. **Exponential Growth**: The dashed line ("DNNs with higher GFLOPs") shows a much steeper increase than the solid line, indicating faster growth in computational power for high-performance models.
2. **Token Count Correlation**: Higher token counts (2048) correlate with significantly higher GFLOPs (1e+06 in 2021), while lower counts (128) remain near the baseline.
3. **Temporal Trends**:
- 128-token models show minimal growth after 2018.
- 1024- and 2048-token models dominate later years, with 2048 tokens achieving orders-of-magnitude higher performance by 2021.
4. **Outliers**: The 2048-token data point in 2021 is an extreme outlier, far exceeding the dashed line’s projection.
### Interpretation
The chart demonstrates a clear relationship between token count, computational power (GFLOPs), and model performance over time. The dashed line represents high-efficiency DNNs that scale more effectively with increasing token counts, while the solid line reflects the average growth of all DNNs. The 2048-token model’s performance in 2021 (1e+06 GFLOPs) suggests a breakthrough in computational efficiency, likely driven by architectural advancements or specialized hardware. Conversely, the stagnation of 128-token models highlights a performance gap, possibly due to limitations in model complexity or resource allocation. This aligns with trends in AI research, where larger models (e.g., transformers) require exponentially more compute to achieve state-of-the-art results.