## Diagram: Router-Based Attention Mechanism
### Overview
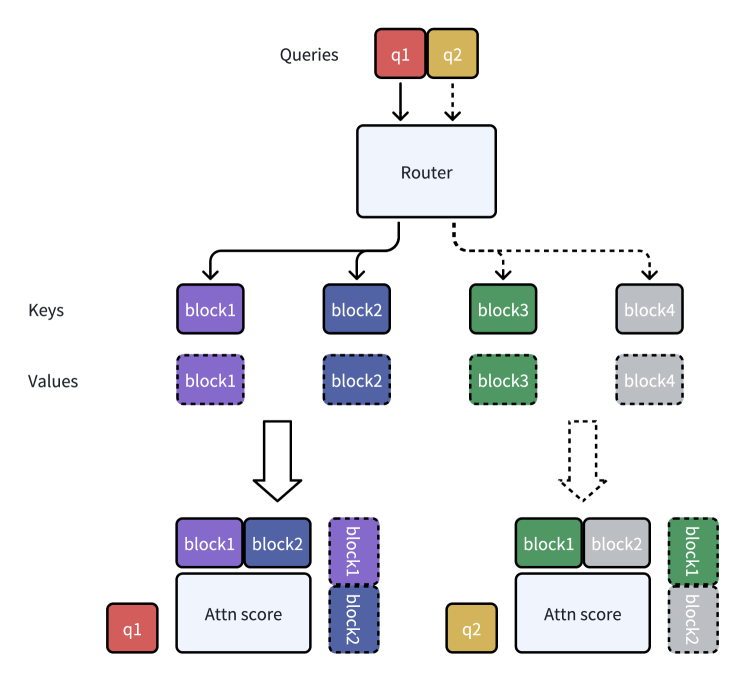
The image illustrates a router-based attention mechanism. It shows how queries are routed to different key-value blocks, and how attention scores are calculated based on the selected blocks. The diagram depicts two queries, q1 and q2, being processed by a router, which then directs them to specific key-value blocks.
### Components/Axes
* **Queries:** Labeled at the top, consisting of two blocks:
* `q1`: Red block.
* `q2`: Yellow block.
* **Router:** A rectangular block labeled "Router" in the center-top of the diagram.
* **Keys:** Labeled on the left, consisting of four blocks:
* `block1`: Purple block.
* `block2`: Blue block.
* `block3`: Green block.
* `block4`: Gray block.
* **Values:** Labeled on the left, consisting of four blocks with dashed borders:
* `block1`: Purple block with dashed border.
* `block2`: Blue block with dashed border.
* `block3`: Green block with dashed border.
* `block4`: Gray block with dashed border.
* **Attention Scores:** Two rectangular blocks labeled "Attn score" at the bottom.
* **Flow Arrows:** Solid and dashed arrows indicating the flow of data.
### Detailed Analysis
1. **Queries:**
* `q1` (red) and `q2` (yellow) are the initial inputs.
2. **Router:**
* The "Router" block receives both `q1` and `q2`.
* `q1` is routed via a solid arrow to `block1` (purple) and `block2` (blue) in the "Keys" section.
* `q2` is routed via a dashed arrow to `block3` (green) and `block4` (gray) in the "Keys" section.
3. **Keys and Values:**
* `q1`'s route selects `block1` (purple) and `block2` (blue) from both the "Keys" and "Values" sections. The "Values" blocks are represented with dashed borders.
* `q2`'s route selects `block3` (green) and `block4` (gray) from both the "Keys" and "Values" sections. The "Values" blocks are represented with dashed borders.
4. **Attention Score Calculation:**
* For `q1`, `block1` (purple) and `block2` (blue) are concatenated and fed into an "Attn score" block. The corresponding `block1` (purple dashed) and `block2` (blue dashed) from the "Values" section are shown to the right, stacked vertically.
* For `q2`, `block3` (green) and `block4` (gray) are concatenated and fed into an "Attn score" block. The corresponding `block3` (green dashed) and `block4` (gray dashed) from the "Values" section are shown to the right, stacked vertically.
5. **Output:**
* The "Attn score" blocks represent the calculated attention scores for each query.
### Key Observations
* The router directs different queries to different sets of key-value blocks.
* The "Values" blocks are represented with dashed borders, possibly indicating they are used differently from the "Keys" blocks.
* The diagram suggests a selective attention mechanism where each query focuses on a specific subset of the key-value pairs.
### Interpretation
The diagram illustrates a router-based attention mechanism, where the router dynamically selects which key-value blocks are relevant for each query. This allows the model to focus on different parts of the input based on the query, potentially improving performance and efficiency. The use of dashed borders for the "Values" blocks might indicate that they are used for weighting or combining information, while the "Keys" blocks are used for determining relevance. The concatenation of key blocks before calculating the attention score suggests that the model considers the relationships between these blocks. The vertical stacking of the dashed value blocks to the right of the attention score box is unclear, but may represent the values being weighted by the attention score.