\n
## Diagram: Router Architecture with Query-Key-Value Attention
### Overview
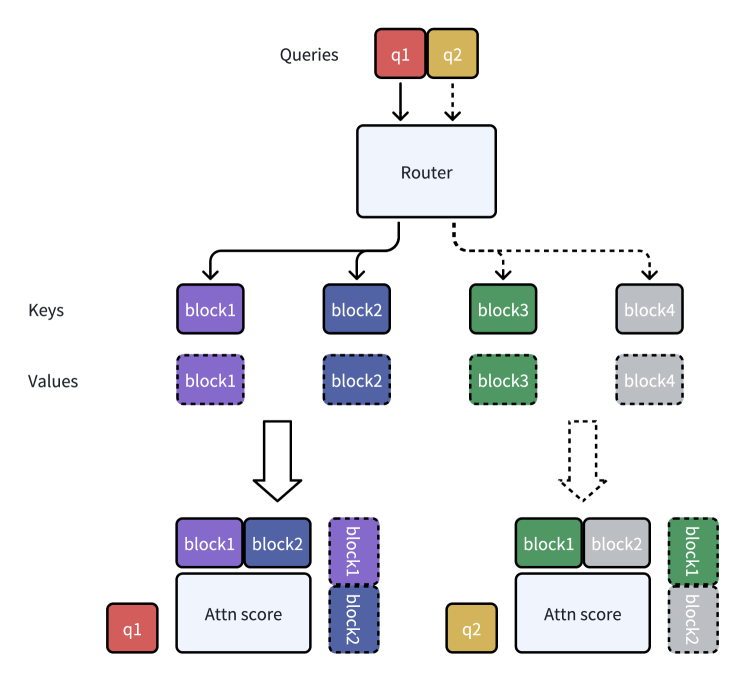
This diagram illustrates a router architecture utilizing a query-key-value attention mechanism. It depicts how queries are routed to different blocks (presumably containing data) and how attention scores are calculated to combine the values from these blocks. The diagram shows two queries (q1 and q2) being processed independently.
### Components/Axes
The diagram consists of the following components:
* **Queries:** Labeled "Queries" at the top, with two specific queries labeled "q1" (orange) and "q2" (orange).
* **Router:** A central rectangular block labeled "Router" (light blue).
* **Keys:** Labeled "Keys" on the left side.
* **Values:** Labeled "Values" on the left side.
* **Blocks:** Four blocks labeled "block1", "block2", "block3", and "block4" (light gray). These are arranged in a row below the Router.
* **Attention Score:** Labeled "Attn score" (light blue) within the output blocks.
* **Arrows:** Arrows indicate the flow of information. Solid arrows represent direct connections, while dotted arrows suggest a more general routing.
* **Output Blocks:** Blocks at the bottom, showing the combined output for each query.
### Detailed Analysis or Content Details
The diagram shows the following flow:
1. **Queries Input:** Two queries, q1 and q2, enter the "Router" from the top.
2. **Routing:** The Router distributes the queries to all four blocks (block1, block2, block3, block4). This is indicated by the arrows extending from the Router to each block.
3. **Key-Value Processing:** Each block has associated "Keys" and "Values". The diagram doesn't explicitly show how keys are used, but it implies they are used within the blocks to determine relevance to the queries.
4. **Attention Score Calculation:** For each query, the outputs from the blocks are combined using an attention mechanism. The "Attn score" block represents this calculation.
5. **Output Generation:** The final output for each query (q1 and q2) is a combination of the outputs from block1 and block2. The output blocks are colored light blue.
Specifically:
* **Query q1:** Receives input from block1 and block2, calculates an attention score, and produces an output.
* **Query q2:** Receives input from block1 and block2, calculates an attention score, and produces an output.
The dotted line from the Router to block3 and block4 suggests that these blocks are not directly used for the current queries (q1 and q2) but are available for other queries or a more complex routing scheme.
### Key Observations
* The diagram focuses on a simplified attention mechanism where only block1 and block2 are used for both queries.
* The Router appears to be a central component responsible for distributing queries to the blocks.
* The attention mechanism is represented abstractly, without details on the specific attention function used.
* The diagram does not provide any numerical values or specific parameters.
### Interpretation
This diagram illustrates a basic router architecture for attention-based processing. The router acts as a dispatcher, sending queries to multiple blocks. Each block processes the query based on its internal "Keys" and "Values", and the attention mechanism combines the outputs from these blocks to generate a final result. The use of only block1 and block2 for both queries suggests a potential simplification or a specific configuration where these blocks are deemed most relevant for the given queries. The dotted lines indicate the potential for a more complex routing scheme involving all four blocks. This architecture could be used in various applications, such as information retrieval, machine translation, or question answering, where it is necessary to selectively attend to different parts of the input data. The diagram is conceptual and does not provide details on the implementation or performance of the system.