TECHNICAL ASSET FINGERPRINT
eb801cbdb201bd15c7fc5948
Click to view fullscreen
Press ESC or click to close
FOUND IN PAPERS
EXPERT: healer-alpha-free VERSION 1
RUNTIME: free/openrouter/healer-alpha
INTEL_VERIFIED
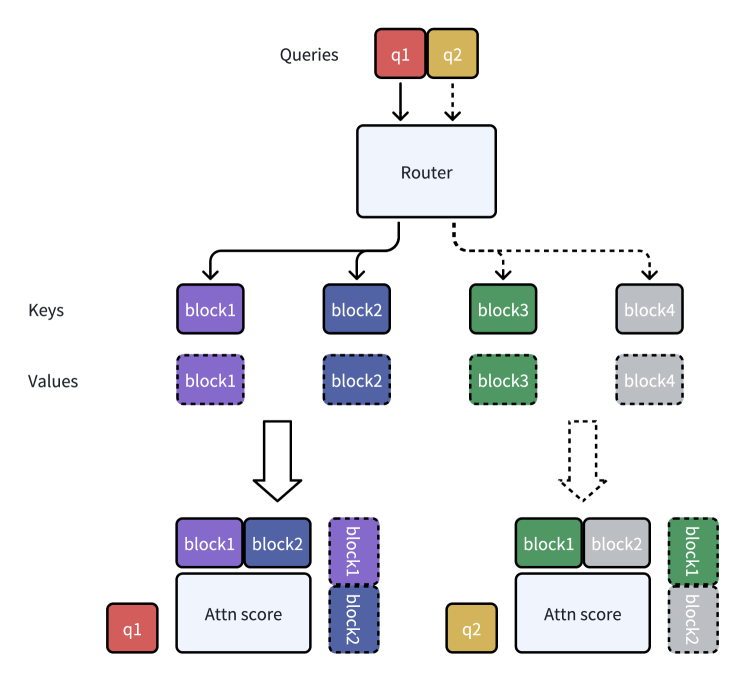
## Diagram: Query Routing and Attention Score Calculation
### Overview
This image is a technical diagram illustrating a two-stage process for handling queries in a computational system, likely a neural network or information retrieval architecture. It shows how incoming queries are routed to specific blocks of keys and values, which are then used to compute attention scores. The diagram uses color-coding and line styles (solid vs. dashed) to distinguish between two parallel processing paths.
### Components/Axes
The diagram is organized into three main horizontal layers, with labels on the left and top.
**Top Layer (Input):**
* **Label (Top-Left):** "Queries"
* **Components:** Two colored boxes representing individual queries.
* `q1`: A red box.
* `q2`: A yellow/gold box.
* **Flow:** Arrows point downward from the queries to the central "Router" component. The arrow from `q1` is solid; the arrow from `q2` is dashed.
**Middle Layer (Routing & Storage):**
* **Central Component:** A large, light-blue box labeled "Router".
* **Left-Side Labels:** "Keys" and "Values", indicating two parallel rows of components below the router.
* **Key Row (Solid Borders):** Four boxes, each a different color.
* `block1`: Purple.
* `block2`: Blue.
* `block3`: Green.
* `block4`: Gray.
* **Value Row (Dashed Borders):** Four boxes directly below their corresponding key boxes, with identical labels and colors.
* `block1`: Purple (dashed border).
* `block2`: Blue (dashed border).
* `block3`: Green (dashed border).
* `block4`: Gray (dashed border).
* **Flow from Router:**
* A solid arrow from the Router points to the `block1`/`block2` pair (left side).
* A dashed arrow from the Router points to the `block3`/`block4` pair (right side).
**Bottom Layer (Computation):**
This layer shows two separate computation groups, one for each query path.
* **Left Group (for q1 path):**
* **Input:** A large, solid downward arrow originates from the space between the `block1` and `block2` keys/values.
* **Components:**
* A red `q1` box (bottom-left).
* A large, light-blue box labeled "Attn score".
* Above the "Attn score" box: Solid-bordered `block1` (purple) and `block2` (blue) boxes.
* To the right of the "Attn score" box: A vertical stack of two dashed-bordered boxes: `block1` (purple) on top of `block2` (blue).
* **Right Group (for q2 path):**
* **Input:** A large, dashed downward arrow originates from the space between the `block3` and `block4` keys/values.
* **Components:**
* A yellow/gold `q2` box (bottom-left).
* A large, light-blue box labeled "Attn score".
* Above the "Attn score" box: Solid-bordered `block3` (green) and `block4` (gray) boxes.
* To the right of the "Attn score" box: A vertical stack of two dashed-bordered boxes: `block1` (purple) on top of `block2` (blue).
### Detailed Analysis
The diagram depicts a selective routing and attention mechanism.
1. **Query Initiation:** Two distinct queries (`q1`, `q2`) enter the system.
2. **Routing Decision:** A central "Router" component directs each query to a specific subset of available key-value blocks.
* The solid line path (associated with `q1`) routes to the left pair: `block1` and `block2`.
* The dashed line path (associated with `q2`) routes to the right pair: `block3` and `block4`.
3. **Key-Value Association:** For each routed pair, the system accesses both the "Key" (solid border) and "Value" (dashed border) representations of the blocks.
4. **Attention Score Computation:** The final stage computes an "Attn score" for each query.
* **For q1's score:** The computation uses the `block1` and `block2` keys (solid) and the `block1` and `block2` values (dashed). The query `q1` itself is also an input.
* **For q2's score:** The computation uses the `block3` and `block4` keys (solid) and the `block3` and `block4` values (dashed). The query `q2` itself is also an input.
* **Notable Anomaly:** In both attention score groups, there is an additional vertical stack of dashed `block1` and `block2` boxes to the right. Their presence in the `q2` path is inconsistent with the routing logic shown, as `q2` was routed to blocks 3 and 4. This may indicate a shared component, a diagrammatic error, or that blocks 1 and 2 are used in a secondary capacity for all queries.
### Key Observations
* **Color Consistency:** Colors are used consistently to identify blocks across the diagram (e.g., `block1` is always purple).
* **Line Style Semantics:** Solid lines and borders are associated with the `q1` path and "Key" components. Dashed lines and borders are associated with the `q2` path and "Value" components.
* **Parallel Structure:** The left and right sides of the diagram mirror each other in structure, emphasizing two parallel processing pipelines.
* **Spatial Grounding:** The legend/labels ("Queries", "Keys", "Values") are positioned on the left margin. The "Router" is centrally located. The two computation groups are separated spatially at the bottom, left for `q1` and right for `q2`.
* **Potential Inconsistency:** The appearance of `block1` and `block2` (dashed) in the attention score calculation for `q2` contradicts the routing logic shown by the dashed arrow from the Router to `block3`/`block4`.
### Interpretation
This diagram illustrates a **conditional computation** or **mixture-of-experts** style architecture. The core idea is that not all data (blocks) are relevant to every query. A router acts as a gatekeeper, dynamically selecting a subset of specialized modules (blocks 1-4) to process each incoming query.
* **What it demonstrates:** It visualizes the flow of information from input queries, through a selective routing mechanism, to the final computation of relevance scores (attention). This is a fundamental pattern in efficient large models, where activating only a subset of parameters per query reduces computational cost.
* **Relationships:** The Router has a one-to-many relationship with the blocks. Each query has a one-to-one relationship with its computed attention score. The Keys and Values for a given block are intrinsically linked but represented separately, which is standard in attention mechanisms where keys are used for matching and values for retrieval.
* **Notable Anomaly/Outlier:** The presence of the `block1`/`block2` stack in the `q2` attention computation is the most significant observation. This could mean:
1. **Diagram Error:** The illustrator mistakenly copied the left-side element to the right.
2. **Shared Context:** Blocks 1 and 2 represent a common, always-available context or memory that is accessed by all queries in addition to their specifically routed blocks.
3. **Hierarchical Attention:** The system performs a two-stage attention: first routing to a primary set of blocks (3 & 4 for q2), then attending to a secondary, universal set of blocks (1 & 2).
Without additional context, the diagram successfully conveys the principle of selective routing for efficient attention but contains an ambiguous element regarding the role of blocks 1 and 2 in the `q2` pathway.
DECODING INTELLIGENCE...