## Line Chart: Model/System Growth Over Time
### Overview
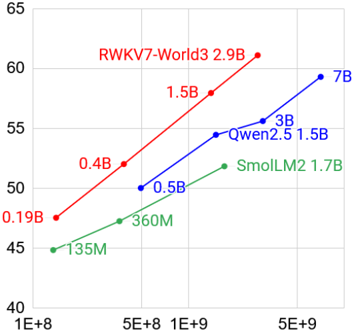
The chart illustrates the growth trajectories of three models/systems over time, measured on a logarithmic scale (x-axis: 1E8 to 5E9) and a linear scale (y-axis: 40 to 65). Three data series are plotted with distinct colors: red (RWKV7-World3), blue (Qwen2.5), and green (SmolLM2). Each line includes labeled data points indicating metric values at specific time intervals.
### Components/Axes
- **X-Axis**: Logarithmic scale labeled with 1E8, 5E8, 1E9, 5E9 (100M to 5B).
- **Y-Axis**: Linear scale from 40 to 65, with increments of 5.
- **Legend**: Located in the top-right corner, associating colors with models:
- Red: RWKV7-World3 (2.9B)
- Blue: Qwen2.5 (1.5B)
- Green: SmolLM2 (1.7B)
- **Data Points**: Embedded labels on lines show metric values (e.g., "0.19B", "3B").
### Detailed Analysis
1. **Red Line (RWKV7-World3)**:
- Starts at 0.19B (y=45) at 1E8.
- Increases to 0.4B (y=52) at 5E8.
- Rises to 1.5B (y=57) at 1E9.
- Peaks at 2.9B (y=60) at 5E9.
- **Trend**: Steep upward slope, indicating rapid growth.
2. **Blue Line (Qwen2.5)**:
- Begins at 0.5B (y=50) at 1E8.
- Jumps to 1.5B (y=55) at 5E8.
- Reaches 3B (y=56) at 1E9.
- Ends at 7B (y=59) at 5E9.
- **Trend**: Consistent upward trajectory with accelerating growth.
3. **Green Line (SmolLM2)**:
- Starts at 135M (y=45) at 1E8.
- Increases to 360M (y=48) at 5E8.
- Ends at 1.7B (y=52) at 5E9.
- **Trend**: Gradual growth, slower than red and blue lines.
### Key Observations
- **RWKV7-World3** demonstrates the highest growth rate, surpassing all others by 5E9.
- **Qwen2.5** shows the largest absolute increase (0.5B to 7B) but starts later than RWKV7-World3.
- **SmolLM2** begins at the lowest value (135M) but grows to 1.7B, suggesting scalability despite initial limitations.
- All lines intersect at y=50 (0.5B) around 5E8, indicating convergence in metric values at this midpoint.
### Interpretation
The chart highlights divergent growth patterns among the models/systems. RWKV7-World3’s exponential growth suggests superior scalability or adoption, while Qwen2.5’s late-stage acceleration may reflect strategic improvements. SmolLM2’s modest growth could indicate niche applicability or resource constraints. The convergence at 0.5B (5E8) implies a critical inflection point where all systems achieved baseline performance, but RWKV7-World3 diverged sharply afterward. This data could inform decisions on model selection, resource allocation, or competitive analysis in a technical domain.