## Image Type: Grid of Handwritten Digits
### Overview
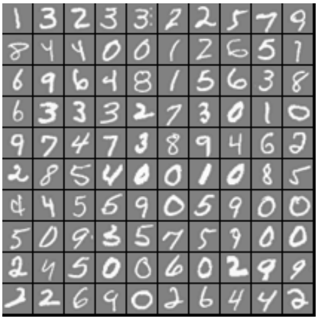
The image displays a 10x10 grid containing 100 individual cells. Each cell contains a single, handwritten digit from 0 to 9. The digits are rendered in a light color (white or light gray) against a darker, textured gray background. The style is consistent with samples from the MNIST (Modified National Institute of Standards and Technology) database, a standard benchmark dataset for machine learning and computer vision tasks involving handwritten digit recognition.
### Components/Axes
* **Structure:** A uniform grid with 10 rows and 10 columns.
* **Cell Content:** Each cell contains one handwritten numeral.
* **Labels/Axes:** There are no axis titles, legends, or numerical markers on the grid itself. The grid is purely a visual arrangement of data samples.
* **Color Scheme:** Light foreground digits on a dark, slightly noisy gray background.
### Detailed Analysis
The following is a precise transcription of the digits in the grid, read row by row from top-left to bottom-right.
**Row 1:** 1, 3, 2, 3, 3, 2, 2, 5, 7, 9
**Row 2:** 8, 4, 4, 0, 0, 1, 2, 6, 5, 1
**Row 3:** 6, 9, 6, 4, 8, 1, 5, 6, 3, 8
**Row 4:** 6, 3, 3, 3, 2, 7, 3, 0, 1, 0
**Row 5:** 9, 7, 4, 7, 3, 8, 9, 4, 6, 2
**Row 6:** 2, 8, 5, 4, 0, 0, 1, 0, 8, 5
**Row 7:** 4, 4, 5, 6, 9, 0, 5, 0, 0, 0
**Row 8:** 5, 0, 9, 3, 5, 7, 5, 9, 0, 0
**Row 9:** 2, 4, 5, 0, 8, 6, 0, 2, 4, 9
**Row 10:** 2, 2, 6, 9, 0, 2, 6, 4, 4, 2
**Digit Frequency Count (Approximate):**
* **0:** 14 instances
* **1:** 5 instances
* **2:** 14 instances
* **3:** 10 instances
* **4:** 10 instances
* **5:** 9 instances
* **6:** 9 instances
* **7:** 5 instances
* **8:** 6 instances
* **9:** 10 instances
### Key Observations
1. **Distribution:** The digits are not uniformly distributed. The digits '0' and '2' appear most frequently (14 times each), while '1' and '7' are the least frequent (5 times each).
2. **Handwriting Variability:** There is significant stylistic variation in how the same digit is written. For example, the digit '2' appears in at least three distinct styles across the grid. The digit '4' shows both open-top and closed-top variants.
3. **Visual Clarity:** All digits are clearly legible, with no ambiguous or severely distorted samples that would be difficult for a human or a well-trained model to classify.
4. **Spatial Arrangement:** The grid appears to be a random sample or a shuffled batch from a larger dataset. There is no apparent ordering by digit value, style, or any other visible characteristic.
### Interpretation
This image is a representative sample from a dataset used for training and evaluating optical character recognition (OCR) systems, specifically for handwritten digits. The grid format is commonly used to visualize a "batch" of data during machine learning model development.
* **What it demonstrates:** The image showcases the core challenge of digit recognition: high intra-class variability (many ways to write the same digit) and the need for a model to learn abstract features rather than memorizing specific shapes.
* **Relationship between elements:** Each cell is an independent data point. The grid as a whole represents a statistical sample, allowing for a quick visual assessment of the dataset's diversity and the relative frequency of different classes within this particular batch.
* **Notable patterns/anomalies:** The uneven frequency distribution is notable. In a perfectly balanced dataset, each digit would appear roughly 10 times in a 100-sample grid. The skew towards '0' and '2' and away from '1' and '7' in this sample could be due to random chance or might reflect an underlying imbalance in the source dataset from which this batch was drawn. This is a critical observation for machine learning, as class imbalance can bias model performance.