## Document: Korean Technical Assessment Form
### Overview
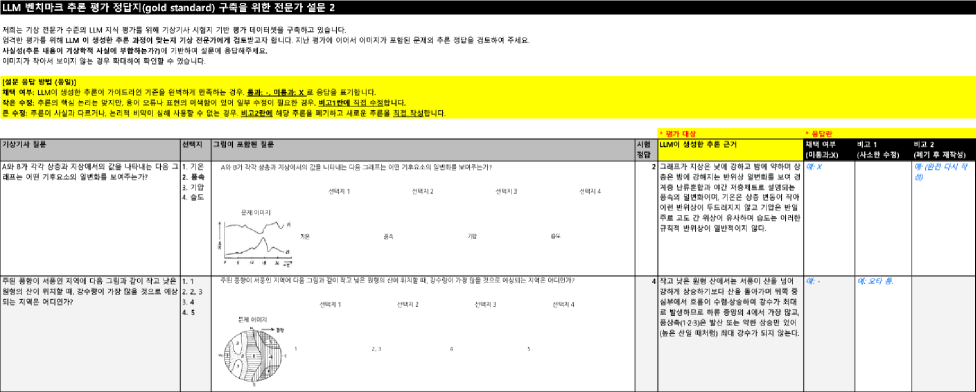
The image is a screenshot of a Korean technical document titled **"LLM 벤치마크 추론 평가 정답지(gold standard) 구축을 위한 전문가 설문 2"** (LLM Benchmark Inference Evaluation Answer Key (Gold Standard) Guidelines for Expert Survey 2). It includes a table with two rows, each containing a question, options, and a diagram. A yellow-highlighted section with Korean text appears above the table, and a legend is located in the top-right corner.
---
### Components/Axes
1. **Title**:
- **Korean**: "LLM 벤치마크 추론 평가 정답지(gold standard) 구축을 위한 전문가 설문 2"
- **Translation**: "LLM Benchmark Inference Evaluation Answer Key (Gold Standard) Guidelines for Expert Survey 2"
2. **Highlighted Section**:
- **Korean**: "추론 평가 전문가 설문지 작성 시 참고 사항" (Notes for Writing the Inference Evaluation Expert Survey)
- **Translation**: "Notes for Writing the Inference Evaluation Expert Survey"
3. **Table Structure**:
- **Columns**:
- **기상기서 설명** (Weather Report Description)
- **선택지** (Options)
- **그림이 포함된 설명** (Description with Diagram)
- **Rows**:
- **Row 1**:
- **Question**: "A와 B 각각 상층과 지상에서의 강을 나타내는 다음 그래프는 어떤 기후 요소의 일변화를 보여주는지?"
- **Translation**: "Which climate element's variation does the graph showing the rivers at upper and ground levels represent?"
- **Options**: 1. 강수량 (Precipitation), 2. 증발 (Evaporation), 3. 기압 (Atmospheric Pressure), 4. 습도 (Humidity)
- **Diagram**: A line graph labeled **"선택지 1"** (Option 1).
- **Row 2**:
- **Question**: "추론 평가 전문가 설문지 작성 시 참고 사항" (Notes for Writing the Inference Evaluation Expert Survey)
- **Translation**: "Notes for Writing the Inference Evaluation Expert Survey"
- **Options**: 1. 기상 요소 (Weather Element), 2. 지형 요소 (Topographic Element), 3. 기후 요소 (Climate Element), 4. 지형 요소 (Topographic Element)
- **Diagram**: A circular diagram labeled **"선택지 1"** (Option 1).
4. **Legend**:
- **Labels**:
- **Korean**: "선택지 1", "선택지 2", "선택지 3", "선택지 4"
- **Translation**: "Option 1", "Option 2", "Option 3", "Option 4"
- **Colors**: Not explicitly described in the image.
---
### Detailed Analysis
1. **Table Content**:
- **Row 1** focuses on interpreting a graph of rivers at different elevations, with options related to climate elements.
- **Row 2** repeats the highlighted section's text, possibly indicating a formatting error or emphasis.
2. **Diagrams**:
- **Row 1 Diagram**: A line graph with a single line labeled **"선택지 1"** (Option 1).
- **Row 2 Diagram**: A circular diagram with a single label **"선택지 1"** (Option 1).
---
### Key Observations
- The document appears to be a **test or assessment form** for evaluating understanding of weather reports and climate elements.
- The **highlighted section** likely contains critical instructions or guidelines for completing the survey.
- The **repeated text** in Row 2 suggests a possible error in the document's formatting.
- The **diagrams** are minimal, with only labels for options, indicating a focus on textual interpretation rather than complex visual analysis.
---
### Interpretation
This document is designed to assess experts' ability to interpret weather-related data and diagrams. The inclusion of a **gold standard** implies it is part of a benchmarking process for evaluating LLM (Large Language Model) performance in technical contexts. The repeated text and minimal diagrams suggest the document may be a draft or template requiring further refinement. The legend's lack of color coding could indicate incomplete formatting or a focus on textual labels over visual cues.