## Diagram: Periodic Function Representation
### Overview
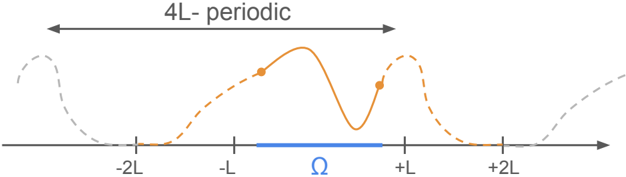
The image depicts a diagram illustrating a periodic function with a period of 4L. It shows a function's behavior over a specific interval and how it repeats. The diagram includes labeled points on the x-axis, a defined region "Ω", and two distinct sections of the function represented by solid and dashed lines.
### Components/Axes
* **X-axis:** Labeled with -2L, -L, +L, and +2L. The axis represents the domain of the function.
* **Y-axis:** Not explicitly labeled, but implicitly represents the function's value.
* **Function Representation:**
* Solid Orange Line: Represents the function's behavior within a specific interval.
* Dashed Orange Line: Represents the function's behavior outside the specific interval.
* Dashed Gray Line: Represents the periodic continuation of the function.
* **Region Ω:** A blue line segment on the x-axis, spanning from approximately -0.75L to +0.75L, labeled with "Ω" below it.
* **Period Label:** A horizontal arrow above the function, labeled "4L - periodic", indicating the function's period.
* **Data Points:** Two orange data points are present on the solid orange line. The first is located approximately at x = -0.5L, and the second is located approximately at x = 0.5L.
### Detailed Analysis
* **Function Behavior:** The solid orange line shows a function that increases from -2L to approximately -0.5L, reaches a local maximum, decreases to a local minimum near 0, increases again to a local maximum near +0.5L, and then decreases towards +2L.
* **Periodic Nature:** The dashed orange line extends the function beyond the interval [-2L, +2L], and the dashed gray line shows the periodic continuation of the function outside of the displayed range.
* **Region Ω:** The blue line segment labeled "Ω" represents a specific region of interest on the x-axis.
### Key Observations
* The function is periodic with a period of 4L.
* The region "Ω" is centered around the origin (0) and spans a width of approximately 1.5L.
* The function exhibits local maxima and minima within the interval [-L, +L].
### Interpretation
The diagram illustrates a periodic function and highlights its behavior within a specific interval. The "Ω" region likely represents a domain of interest for analysis or application of the function. The dashed lines indicate the function's periodic nature, suggesting that its behavior repeats every 4L units along the x-axis. The data points on the solid orange line may represent specific values or critical points of the function within the displayed interval. The diagram is useful for visualizing and understanding the properties of periodic functions and their behavior over different intervals.