Here is a detailed technical description of the image.
### Chart Overview
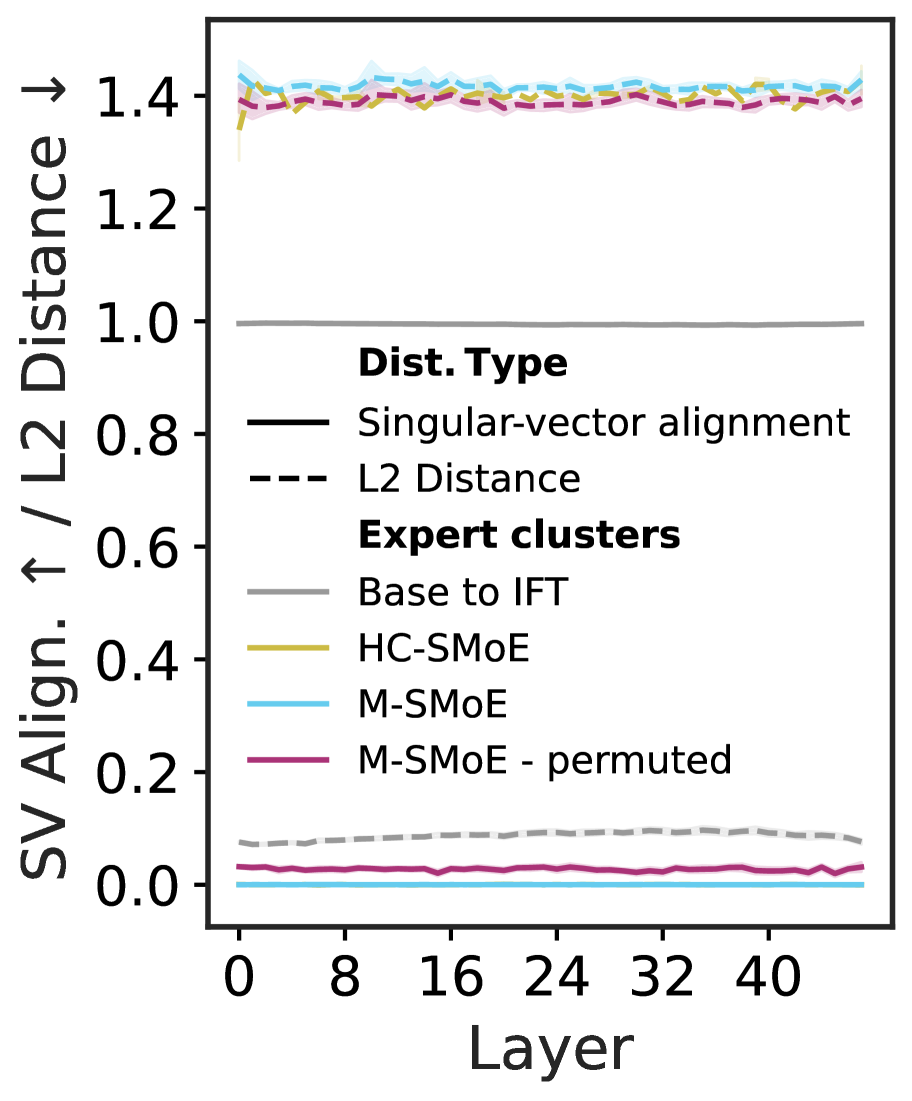
The image is a line chart plotting two different metrics, "SV Align." (Singular-vector alignment) and "L2 Distance," across different layers of a model. The chart includes a legend specifying the line styles for the metrics and colors for different "Expert clusters."
### Axes and Labels
* **X-Axis:**
* **Label:** "Layer"
* **Markers:** 0, 8, 16, 24, 32, 40. The axis extends from 0 to approximately 48.
* **Y-Axis:**
* **Label:** "SV Align. ↑ / L2 Distance ↓"
* The upward arrow (↑) next to "SV Align." indicates that higher values are better or represent greater alignment.
* The downward arrow (↓) next to "L2 Distance" indicates that lower values are better or represent smaller distance.
* **Markers:** 0.0, 0.2, 0.4, 0.6, 0.8, 1.0, 1.2, 1.4. The axis range is from 0.0 to 1.5.
### Legend
The legend is positioned within the chart area, approximately in the center. It is divided into two sections:
1. **Dist. Type** (defines line style):
* **Solid Line (—):** "Singular-vector alignment"
* **Dashed Line (---):** "L2 Distance"
2. **Expert clusters** (defines line color):
* **Grey:** "Base to IFT"
* **Yellow/Gold:** "HC-SMoE"
* **Light Blue:** "M-SMoE"
* **Purple/Magenta:** "M-SMoE - permuted"
### Data Series Analysis
The chart plots several lines representing combinations of "Dist. Type" and "Expert clusters."
#### Singular-vector alignment (Solid Lines)
* **Base to IFT (Grey, Solid):** This line is perfectly flat and constant at a value of **1.0** across all layers from 0 to ~48.
* **M-SMoE (Light Blue, Solid):** This line is perfectly flat and constant at a value of **0.0** across all layers.
* **M-SMoE - permuted (Purple, Solid):** This line is relatively flat, maintaining a low value of approximately **0.02** across all layers.
* **HC-SMoE (Yellow, Solid):** A solid yellow line is not visible on the chart, suggesting it is either not plotted or overlaps perfectly with another line (likely the M-SMoE line at 0.0).
#### L2 Distance (Dashed Lines)
* **Base to IFT (Grey, Dashed):** This line starts at a low value of approximately **0.05** at Layer 0 and shows a gradual, slight upward trend, reaching approximately **0.10** by Layer 48.
* **The three "SMoE" cluster variants show high and relatively stable L2 distances, with slight fluctuations and shaded regions indicating variability:**
* **M-SMoE (Light Blue, Dashed):** This line is the highest among the dashed lines, fluctuating around a value of approximately **1.41** across all layers.
* **HC-SMoE (Yellow, Dashed):** This line is situated just below the M-SMoE line, fluctuating around a value of approximately **1.40**.
* **M-SMoE - permuted (Purple, Dashed):** This line is the lowest of the three high-value dashed lines, fluctuating around a value of approximately **1.38**.
### Summary of Trends
* For **Singular-vector alignment (higher is better)**, the "Base to IFT" model shows perfect alignment (1.0), while the "M-SMoE" and "M-SMoE - permuted" models show near-zero alignment.
* For **L2 Distance (lower is better)**, the "Base to IFT" model shows a very low distance that slightly increases with depth. In contrast, all "SMoE" variants exhibit a consistently high L2 distance across all layers, with "M-SMoE" having the highest distance and "M-SMoE - permuted" having the lowest among them.