# Technical Document Extraction: Chart Analysis
## Chart Components
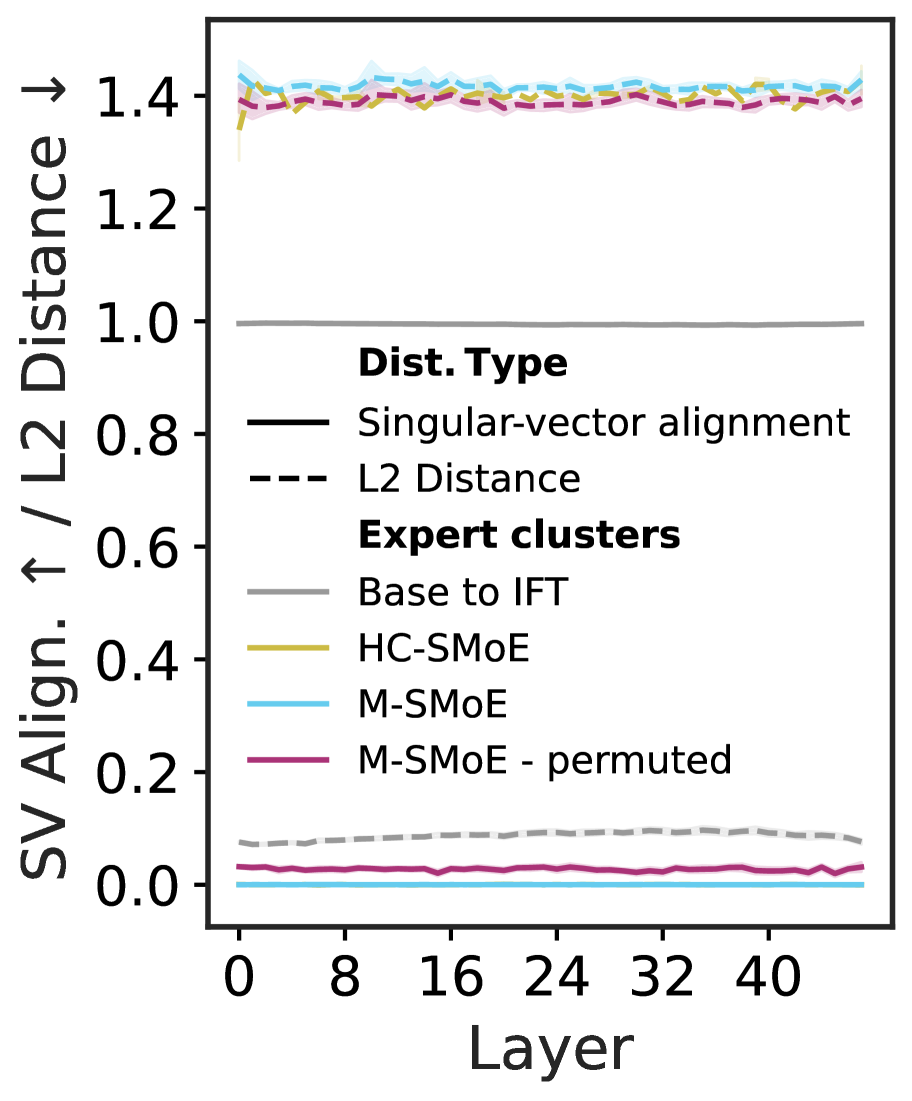
### Axes
- **X-axis (Horizontal):**
- Label: `Layer`
- Range: `0` to `40` (increments of `8`)
- **Y-axis (Vertical):**
- Label: `SV Align. ↑ / L2 Distance ↓`
- Range: `0.0` to `1.4`
### Legend
- **Dist. Type (Distance Type):**
- `Singular-vector alignment` (solid line)
- `L2 Distance` (dashed line)
- **Expert clusters:**
- `Base to IFT` (gray dashed line)
- `HC-SMoE` (yellow line)
- `M-SMoE` (blue line)
- `M-SMoE - permuted` (magenta line)
### Key Trends
1. **Base to IFT (gray dashed line):**
- Remains relatively stable across all layers.
- Slight upward trend observed between layers `0` and `8`.
2. **HC-SMoE (yellow line) and M-SMoE (blue line):**
- Overlap significantly throughout the chart.
- Both exhibit minor fluctuations but remain near the top of the y-axis range (`~1.4`).
3. **M-SMoE - permuted (magenta line):**
- Consistently lower than `HC-SMoE` and `M-SMoE`.
- Slightly higher than `Base to IFT` but remains near the bottom of the y-axis range (`~0.2`).
4. **L2 Distance (dashed line):**
- Horizontal line at `1.0` across all layers.
### Observations
- The `SV Alignment / L2 Distance` ratio for `HC-SMoE` and `M-SMoE` is consistently higher than for `Base to IFT` and `M-SMoE - permuted`.
- `M-SMoE - permuted` shows the lowest performance relative to other clusters.
- No significant divergence between `HC-SMoE` and `M-SMoE` across layers.
## Diagram Structure
- **Lines:**
- Solid lines represent `Singular-vector alignment`.
- Dashed lines represent `L2 Distance`.
- Colored lines correspond to specific expert clusters.
- **Shading:**
- No explicit shading present; lines are unfilled.
## Data Points
- **Layer 0:**
- `Base to IFT`: ~0.05
- `HC-SMoE`: ~1.4
- `M-SMoE`: ~1.4
- `M-SMoE - permuted`: ~0.2
- **Layer 40:**
- `Base to IFT`: ~0.05
- `HC-SMoE`: ~1.4
- `M-SMoE`: ~1.4
- `M-SMoE - permuted`: ~0.2
## Notes
- The chart compares the performance of different expert clusters (`Base to IFT`, `HC-SMoE`, `M-SMoE`, `M-SMoE - permuted`) across layers.
- `L2 Distance` serves as a reference metric, remaining constant at `1.0`.
- All lines are plotted against the `Layer` axis, indicating performance trends across model depth.