\n
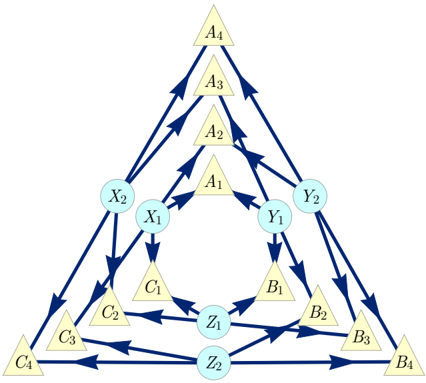
## Diagram: Network Flow Representation
### Overview
The image depicts a directed graph representing a network flow. The nodes are represented by geometric shapes (triangles and circles) and are connected by directed edges (arrows). The diagram appears to illustrate relationships between different sets of variables (A, B, C, X, Y, Z) indexed from 1 to 4.
### Components/Axes
The diagram consists of the following components:
* **Nodes:**
* A1, A2, A3, A4 (Triangles, positioned at the top)
* B1, B2, B3, B4 (Triangles, positioned at the bottom-right)
* C1, C2, C3, C4 (Triangles, positioned at the bottom-left)
* X1, X2 (Yellow shapes, positioned left of A1, A2)
* Y1, Y2 (Yellow shapes, positioned right of A1, A2)
* Z1, Z2 (Circles, positioned at the center-bottom)
* **Edges:** Directed arrows connecting the nodes, indicating the flow direction.
### Detailed Analysis or Content Details
The diagram shows a complex network of connections. Here's a breakdown of the connections:
* **A Series:** A4 -> A3 -> A2 -> A1.
* **B Series:** B4 -> B3 -> B2 -> B1.
* **C Series:** C4 -> C3 -> C2 -> C1.
* **X Series:** X2 -> X1.
* **Y Series:** Y2 -> Y1.
* **Z Series:** Z2 -> Z1.
The following connections exist between these series:
* A4 -> B4, A4 -> C4
* A3 -> B3, A3 -> C3
* A2 -> B2, A2 -> C2
* A1 -> B1, A1 -> C1
* X2 -> C1, X1 -> C2
* Y2 -> B1, Y1 -> B2
* C1 -> Z1, C2 -> Z1
* B1 -> Z2, B2 -> Z2
* Z1 -> A1, Z2 -> A1
### Key Observations
* The A, B, and C series form converging paths towards A1, B1, and C1 respectively.
* The X and Y series feed into the C and B series respectively.
* The Z series acts as a convergence point for C and B, and then feeds back into A.
* The diagram is symmetrical in its structure, with A, B, and C series mirroring each other.
### Interpretation
This diagram likely represents a system with multiple interacting components. The A series could represent a primary process or output, while the B and C series represent contributing factors or inputs. The X and Y series could be intermediate variables influencing the inputs. The Z series appears to be a feedback mechanism, influencing the primary process (A).
The structure suggests a hierarchical system where information flows from multiple sources (X, Y, B, C) through intermediate stages (Z) to a central process (A). The convergence of paths onto A1 suggests a bottleneck or a point of integration. The symmetry of the diagram implies a balanced or reciprocal relationship between the B and C series.
The diagram doesn't provide quantitative data, but it visually demonstrates the relationships and flow of information within the system. It could be a representation of a control system, a decision-making process, or a complex network of dependencies. The diagram is a qualitative representation of a system, and further analysis would require understanding the meaning of the variables and the nature of the relationships between them.