\n
## Directed Graph Diagram: Hierarchical Network with Intermediary Nodes
### Overview
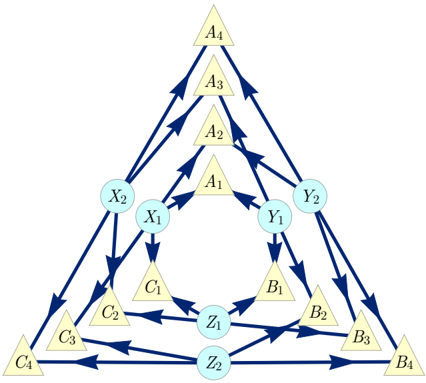
The image displays a directed graph (network diagram) composed of nodes connected by directional arrows. The nodes are categorized by shape and label prefix, forming a structured, hierarchical network with multiple pathways. The diagram appears to represent a system of relationships, dependencies, or flows between different entities.
### Components/Axes
**Node Types & Labels:**
1. **Yellow Triangles (Primary Nodes):**
* **A-Series:** A₁, A₂, A₃, A₄ (arranged vertically in the top-center).
* **B-Series:** B₁, B₂, B₃, B₄ (arranged vertically on the right side).
* **C-Series:** C₁, C₂, C₃, C₄ (arranged vertically on the left side).
2. **Light Blue Circles (Intermediary/Connector Nodes):**
* **X-Series:** X₁, X₂ (positioned between the A and C series).
* **Y-Series:** Y₁, Y₂ (positioned between the A and B series).
* **Z-Series:** Z₁, Z₂ (positioned between the B and C series at the bottom).
**Connections (Directed Arrows):**
All connections are represented by dark blue arrows indicating directionality from a source node to a target node. The graph is fully connected, with no isolated nodes.
### Detailed Analysis
**Spatial Layout & Connectivity:**
* **Central A-Series Hierarchy:** A₄ → A₃ → A₂ → A₁ forms a vertical chain. A₄ is the apex node.
* **Right-Side B-Series Hierarchy:** B₁ → B₂ → B₃ → B₄ forms a vertical chain.
* **Left-Side C-Series Hierarchy:** C₁ → C₂ → C₃ → C₄ forms a vertical chain.
* **Intermediary Node Roles:**
* **X₂:** Receives input from A₄. Outputs to X₁, C₄, and C₃.
* **X₁:** Receives input from A₂ and X₂. Outputs to C₂ and C₁.
* **Y₂:** Receives input from A₄. Outputs to Y₁, B₄, and B₃.
* **Y₁:** Receives input from A₂ and Y₂. Outputs to B₂ and B₁.
* **Z₂:** Receives input from C₄ and B₄. Outputs to Z₁, C₃, and B₃.
* **Z₁:** Receives input from C₂, B₂, and Z₂. Outputs to C₁ and B₁.
**Complete Connection List (Source → Target):**
* A₄ → A₃, X₂, Y₂
* A₃ → A₂
* A₂ → A₁, X₁, Y₁
* X₂ → X₁, C₄, C₃
* X₁ → C₂, C₁
* Y₂ → Y₁, B₄, B₃
* Y₁ → B₂, B₁
* Z₂ → Z₁, C₃, B₃
* Z₁ → C₁, B₁
* C₄ → Z₂
* C₂ → Z₁
* B₄ → Z₂
* B₂ → Z₁
*Note: Nodes A₁, C₃, C₁, B₃, and B₁ have no outgoing connections as per the diagram.*
### Key Observations
1. **Symmetry:** The graph exhibits near-perfect bilateral symmetry along the vertical axis running through the A-series nodes. The left (C-series, X-nodes) and right (B-series, Y-nodes) sides are mirror images in structure and connectivity.
2. **Hierarchy and Flow:** There is a clear top-down flow from the A₄ apex. The Z-series nodes (Z₁, Z₂) act as a secondary convergence point at the bottom, integrating flows from both the B and C branches before feeding back into them.
3. **Convergence Points:** Key nodes that receive multiple inputs are X₁, Y₁, Z₁, Z₂, C₁, and B₁. This suggests they are integration or decision points within the system.
4. **No Terminal Nodes:** Every node, including A₁, C₁, and B₁, is a target of at least one arrow. The graph represents a closed system of continuous potential flow.
### Interpretation
The structure suggests several possible interpretations:
* **Organizational or Decision-Making Flow:** A₄ could represent a CEO or primary goal. The A-series is executive leadership, delegating to divisions (B and C) via liaisons (X and Y). The Z-nodes could represent cross-functional teams or middle management synthesizing information from the divisions before it cycles back.
* **Information Processing or Neural Network:** It could depict a multi-layered network where A is the input layer, X/Y are hidden processing layers, B/C are parallel output or feature layers, and Z is a feedback or consolidation layer.
* **Supply Chain or Logistics:** A₄ is the primary supplier, feeding into regional distributors (X₂/Y₂), who supply local warehouses (C₄/B₄). Z₂ could be a central logistics hub redistributing goods between regional chains.
The **key systemic insight** is the presence of **feedback loops**. For example, information can flow A₄ → Y₂ → B₄ → Z₂ → C₃ → X₂ → A₄ (via the connection to X₂, which feeds back into the system). This indicates a dynamic, adaptive system rather than a simple linear process. The symmetry implies balanced design, while the multiple convergence points (Z₁, Z₂) highlight critical nodes whose failure would significantly disrupt system-wide communication.