## Bar Chart: Evaluation on Verification and Correction (Base Model: Qwen2.5-Math-7B)
### Overview
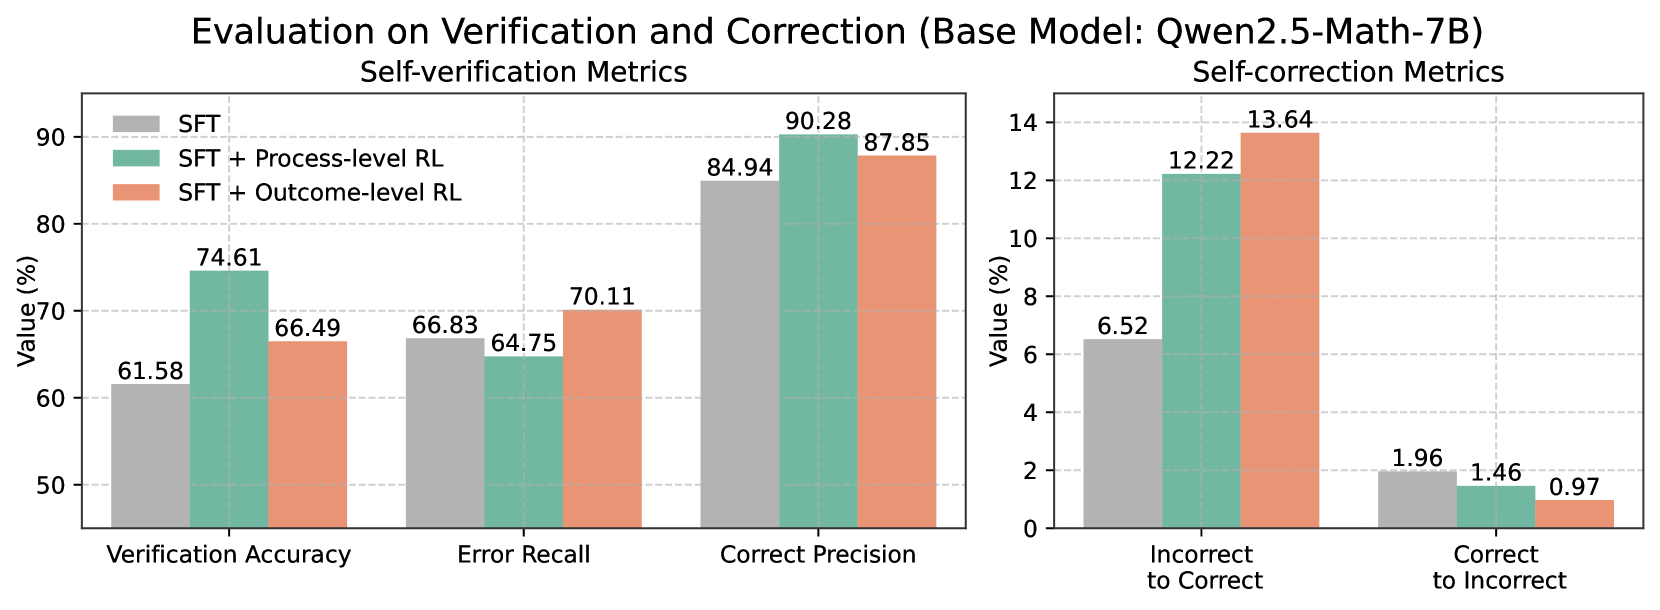
The image presents two bar charts comparing the performance of different models (SFT, SFT + Process-level RL, and SFT + Outcome-level RL) on self-verification and self-correction metrics. The left chart focuses on self-verification metrics (Verification Accuracy, Error Recall, Correct Precision), while the right chart focuses on self-correction metrics (Incorrect to Correct, Correct to Incorrect).
### Components/Axes
**Left Chart (Self-verification Metrics):**
* **Title:** Self-verification Metrics
* **X-axis:** Categorical axis with three categories: "Verification Accuracy", "Error Recall", and "Correct Precision".
* **Y-axis:** "Value (%)", ranging from 50 to 90 in increments of 10.
* **Legend:** Located in the top-left corner.
* Gray: SFT
* Teal: SFT + Process-level RL
* Peach: SFT + Outcome-level RL
**Right Chart (Self-correction Metrics):**
* **Title:** Self-correction Metrics
* **X-axis:** Categorical axis with two categories: "Incorrect to Correct" and "Correct to Incorrect".
* **Y-axis:** "Value (%)", ranging from 0 to 14 in increments of 2.
* **Legend:** (Same as left chart)
* Gray: SFT
* Teal: SFT + Process-level RL
* Peach: SFT + Outcome-level RL
### Detailed Analysis
**Left Chart (Self-verification Metrics):**
* **Verification Accuracy:**
* SFT (Gray): 61.58%
* SFT + Process-level RL (Teal): 74.61%
* SFT + Outcome-level RL (Peach): 66.49%
* Trend: SFT + Process-level RL performs the best, followed by SFT + Outcome-level RL, and then SFT.
* **Error Recall:**
* SFT (Gray): 66.83%
* SFT + Process-level RL (Teal): 64.75%
* SFT + Outcome-level RL (Peach): 70.11%
* Trend: SFT + Outcome-level RL performs the best, followed by SFT, and then SFT + Process-level RL.
* **Correct Precision:**
* SFT (Gray): 84.94%
* SFT + Process-level RL (Teal): 90.28%
* SFT + Outcome-level RL (Peach): 87.85%
* Trend: SFT + Process-level RL performs the best, followed by SFT + Outcome-level RL, and then SFT.
**Right Chart (Self-correction Metrics):**
* **Incorrect to Correct:**
* SFT (Gray): 6.52%
* SFT + Process-level RL (Teal): 12.22%
* SFT + Outcome-level RL (Peach): 13.64%
* Trend: SFT + Outcome-level RL performs the best, followed by SFT + Process-level RL, and then SFT.
* **Correct to Incorrect:**
* SFT (Gray): 1.96%
* SFT + Process-level RL (Teal): 1.46%
* SFT + Outcome-level RL (Peach): 0.97%
* Trend: SFT performs the worst, followed by SFT + Process-level RL, and then SFT + Outcome-level RL.
### Key Observations
* SFT + Process-level RL generally performs better than SFT and SFT + Outcome-level RL in self-verification metrics, especially in Verification Accuracy and Correct Precision.
* SFT + Outcome-level RL shows the best performance in Error Recall and Incorrect to Correct metrics.
* All models have a low percentage of "Correct to Incorrect" transitions.
### Interpretation
The charts suggest that incorporating reinforcement learning (RL) into the SFT model, either at the process level or outcome level, generally improves performance in both self-verification and self-correction tasks. The specific type of RL (process-level vs. outcome-level) seems to have a varying impact depending on the metric being evaluated. SFT + Process-level RL excels in accuracy and precision, while SFT + Outcome-level RL is better at recalling errors and correcting incorrect answers. The low "Correct to Incorrect" values across all models indicate a relatively stable performance in maintaining correct answers. The base SFT model consistently underperforms compared to the RL-enhanced models, highlighting the benefits of incorporating RL techniques for these tasks.