## Bar Chart: Evaluation on Verification and Correction
### Overview
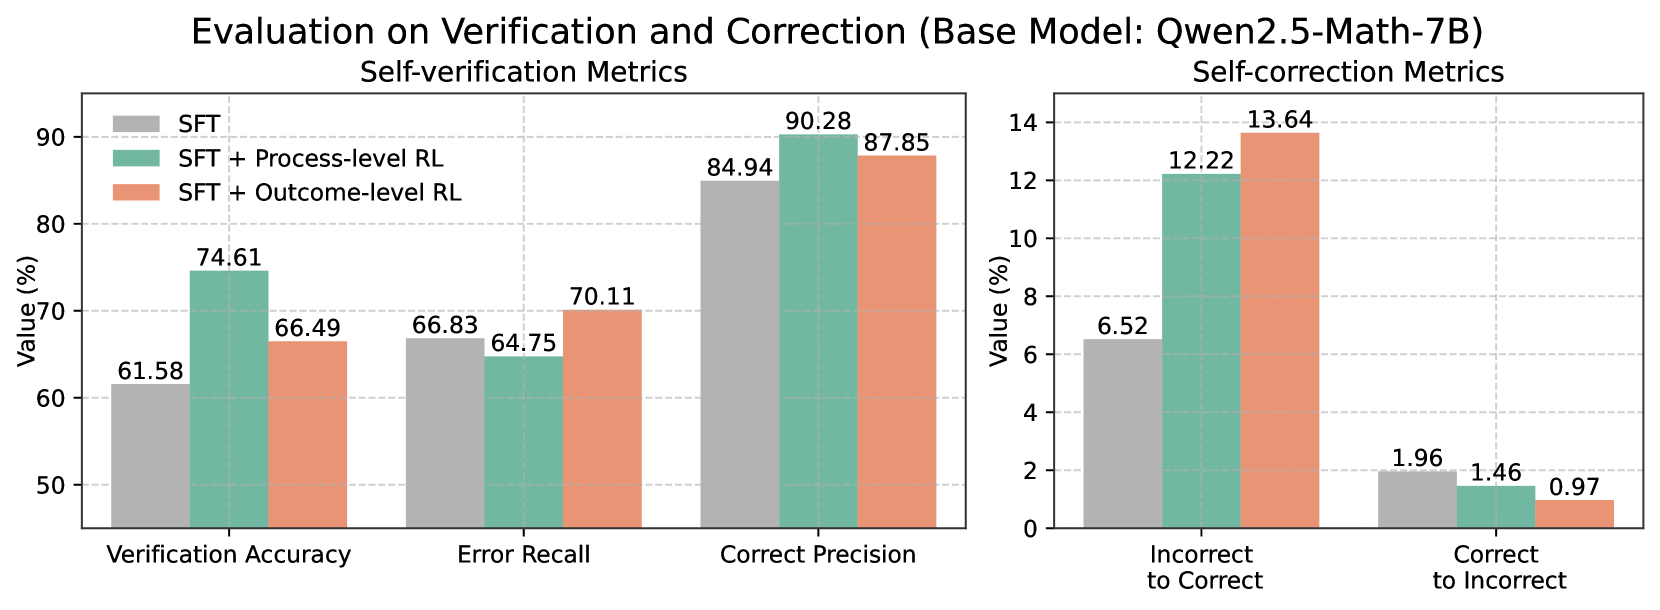
This image presents a bar chart comparing the performance of a base model (Qwen2.5-Math-7B) and its variations trained with different reinforcement learning (RL) techniques. The chart is split into two sections: "Self-verification Metrics" and "Self-correction Metrics". Each section displays three data series representing different training approaches: Supervised Fine-Tuning (SFT), SFT + Process-level RL, and SFT + Outcome-level RL. The y-axis represents "Value (%)".
### Components/Axes
* **Title:** Evaluation on Verification and Correction (Base Model: Qwen2.5-Math-7B)
* **Subtitle 1:** Self-verification Metrics
* **Subtitle 2:** Self-correction Metrics
* **X-axis (Self-verification):** Verification Accuracy, Error Recall, Correct Precision
* **X-axis (Self-correction):** Incorrect to Correct, Correct to Incorrect
* **Y-axis:** Value (%) - Scale ranges from 0 to 90 for the left chart and 0 to 14 for the right chart.
* **Legend:**
* SFT (Red)
* SFT + Process-level RL (Green)
* SFT + Outcome-level RL (Teal)
### Detailed Analysis or Content Details
**Self-verification Metrics (Left Chart)**
* **Verification Accuracy:**
* SFT: Approximately 61.58%
* SFT + Process-level RL: Approximately 66.49%
* SFT + Outcome-level RL: Approximately 74.61%
* Trend: The bars increase in height from SFT to SFT + Process-level RL to SFT + Outcome-level RL.
* **Error Recall:**
* SFT: Approximately 64.75%
* SFT + Process-level RL: Approximately 66.83%
* SFT + Outcome-level RL: Approximately 70.11%
* Trend: The bars increase in height from SFT to SFT + Process-level RL to SFT + Outcome-level RL.
* **Correct Precision:**
* SFT: Approximately 84.94%
* SFT + Process-level RL: Approximately 87.85%
* SFT + Outcome-level RL: Approximately 90.28%
* Trend: The bars increase in height from SFT to SFT + Process-level RL to SFT + Outcome-level RL.
**Self-correction Metrics (Right Chart)**
* **Incorrect to Correct:**
* SFT: Approximately 6.52%
* SFT + Process-level RL: Approximately 12.22%
* SFT + Outcome-level RL: Approximately 13.64%
* Trend: The bars increase in height from SFT to SFT + Process-level RL to SFT + Outcome-level RL.
* **Correct to Incorrect:**
* SFT: Approximately 0.97%
* SFT + Process-level RL: Approximately 1.46%
* SFT + Outcome-level RL: Approximately 1.96%
* Trend: The bars increase in height from SFT to SFT + Process-level RL to SFT + Outcome-level RL.
### Key Observations
* In all metrics, the "SFT + Outcome-level RL" consistently outperforms both "SFT" and "SFT + Process-level RL".
* The "SFT + Process-level RL" generally shows improvement over the base "SFT" model.
* The "Incorrect to Correct" metric shows a more substantial increase with RL training compared to the "Correct to Incorrect" metric.
* The scale of the Y-axis differs between the two charts, indicating different ranges of values for self-verification and self-correction metrics.
### Interpretation
The data suggests that incorporating reinforcement learning, particularly at the outcome level, significantly improves both the self-verification and self-correction capabilities of the Qwen2.5-Math-7B model. The model is better at identifying and correcting errors when trained with outcome-level RL. The larger gains observed in the "Incorrect to Correct" metric suggest that the RL training is particularly effective in enabling the model to recover from incorrect initial responses. The consistent improvement across all metrics indicates that the RL techniques are generally beneficial for enhancing the model's performance in both verifying its own work and correcting its mistakes. The difference in Y-axis scales suggests that the magnitude of improvement is greater in the self-verification metrics than in the self-correction metrics. This could indicate that the model is already relatively good at correcting its own errors, but has more room for improvement in accurately assessing the correctness of its initial responses.