## Bar Charts: Evaluation on Verification and Correction (Base Model: Qwen2.5-Math-7B)
### Overview
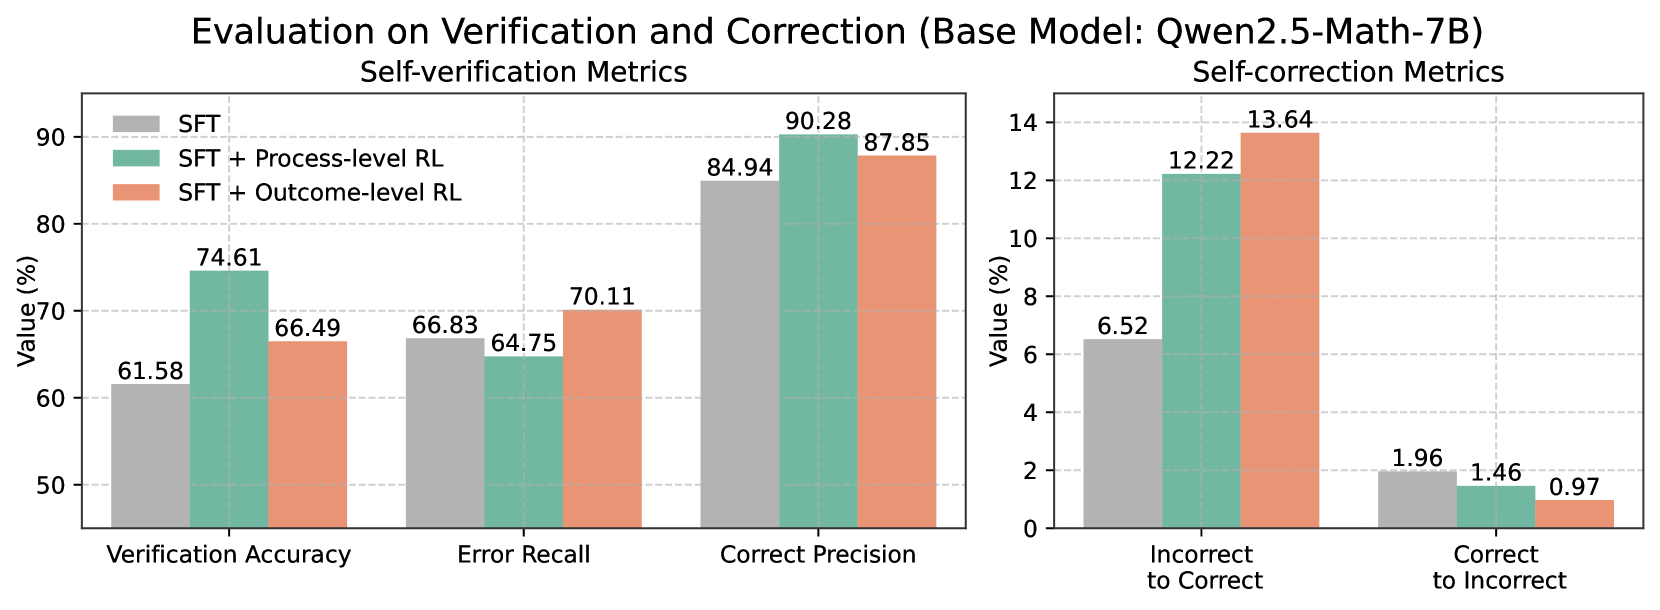
The image contains two side-by-side bar charts comparing performance metrics for three model configurations:
1. **SFT** (Self-Taught Fine-tuning)
2. **SFT + Process-level RL** (Reinforcement Learning)
3. **SFT + Outcome-level RL**
Metrics are split into **Self-verification** (left chart) and **Self-correction** (right chart). All values are percentages.
---
### Components/Axes
#### Left Chart (Self-verification Metrics)
- **X-axis**:
- Verification Accuracy
- Error Recall
- Correct Precision
- **Y-axis**: Value (%) from 0% to 90%
- **Legend**:
- Gray: SFT
- Teal: SFT + Process-level RL
- Orange: SFT + Outcome-level RL
#### Right Chart (Self-correction Metrics)
- **X-axis**:
- Incorrect to Correct
- Correct to Incorrect
- **Y-axis**: Value (%) from 0% to 14%
- **Legend**: Same color coding as left chart
---
### Detailed Analysis
#### Self-verification Metrics (Left Chart)
1. **Verification Accuracy**
- SFT: 61.58%
- SFT + Process-level RL: 74.61%
- SFT + Outcome-level RL: 66.49%
2. **Error Recall**
- SFT: 66.83%
- SFT + Process-level RL: 64.75%
- SFT + Outcome-level RL: 70.11%
3. **Correct Precision**
- SFT: 84.94%
- SFT + Process-level RL: 90.28%
- SFT + Outcome-level RL: 87.85%
#### Self-correction Metrics (Right Chart)
1. **Incorrect to Correct**
- SFT: 6.52%
- SFT + Process-level RL: 12.22%
- SFT + Outcome-level RL: 13.64%
2. **Correct to Incorrect**
- SFT: 1.96%
- SFT + Process-level RL: 1.46%
- SFT + Outcome-level RL: 0.97%
---
### Key Observations
1. **Self-verification**:
- **SFT + Process-level RL** outperforms SFT in all metrics, with the largest gain in **Verification Accuracy** (+13.03%).
- **SFT + Outcome-level RL** shows mixed results: lower than SFT in Verification Accuracy but higher in Error Recall and Correct Precision.
2. **Self-correction**:
- **SFT + Outcome-level RL** achieves the highest **Incorrect to Correct** rate (+7.12% over SFT) and the lowest **Correct to Incorrect** rate (-1.01% over SFT).
- **SFT + Process-level RL** improves **Incorrect to Correct** by 5.7% over SFT but underperforms Outcome-level RL.
---
### Interpretation
1. **Process-level RL** enhances **verification robustness**, particularly in **Correct Precision** (90.28%), suggesting it improves the model's ability to identify valid solutions.
2. **Outcome-level RL** excels in **correction efficiency**, reducing errors (Correct to Incorrect drops to 0.97%) while maximizing successful corrections (Incorrect to Correct: 13.64%).
3. **Trade-offs**:
- Process-level RL slightly reduces Error Recall (64.75% vs. SFT's 66.83%), possibly due to stricter validation.
- Outcome-level RL sacrifices some verification accuracy (66.49% vs. SFT's 61.58%) but gains significant correction performance.
The data implies that **Process-level RL** is optimal for tasks requiring high verification accuracy, while **Outcome-level RL** is better suited for error correction scenarios. Combining both approaches could balance these trade-offs.