## Diagram: Training Process with DPO and Distillation
### Overview
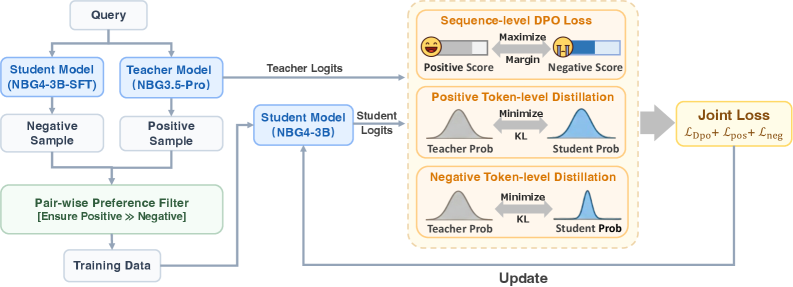
The image is a diagram illustrating a training process that incorporates Direct Preference Optimization (DPO) and token-level distillation. It shows the flow of data from a query, through student and teacher models, and into a loss function that updates the student model.
### Components/Axes
* **Top-Left:** Input "Query"
* **Models:**
* "Student Model (NBG4-3B-SFT)"
* "Teacher Model (NBG3.5-Pro)"
* "Student Model (NBG4-3B)"
* **Samples:**
* "Negative Sample"
* "Positive Sample"
* **Filter:** "Pair-wise Preference Filter [Ensure Positive >>> Negative]"
* **Output:** "Training Data"
* **Losses (Right Side):**
* "Sequence-level DPO Loss"
* "Positive Token-level Distillation"
* "Negative Token-level Distillation"
* **Final Loss:** "Joint Loss: Ldpo + Lpos + Lneg"
* **Update:** Feedback loop from "Joint Loss" to "Student Model (NBG4-3B)"
### Detailed Analysis
1. **Query Processing:**
* A "Query" is input.
* The query is fed into both a "Student Model (NBG4-3B-SFT)" and a "Teacher Model (NBG3.5-Pro)".
* "Teacher Logits" are output from the Teacher Model and fed into the "Sequence-level DPO Loss" block.
* "Negative Sample" and "Positive Sample" are generated.
2. **Preference Filtering:**
* The "Negative Sample" and "Positive Sample" are passed to a "Pair-wise Preference Filter [Ensure Positive >>> Negative]".
* The output of the filter is "Training Data".
3. **Loss Calculation:**
* The "Training Data" is fed back into the "Student Model (NBG4-3B)".
* "Student Logits" are output from the Student Model and fed into the "Positive Token-level Distillation" and "Negative Token-level Distillation" blocks.
* **Sequence-level DPO Loss:**
* "Positive Score" is represented by a smiling face emoji and a horizontal bar.
* "Negative Score" is represented by a frowning face emoji and a horizontal bar.
* The goal is to "Maximize" the "Margin" between the positive and negative scores.
* **Positive Token-level Distillation:**
* "Teacher Prob" is represented by a gray bell curve.
* "Student Prob" is represented by a blue bell curve.
* The goal is to "Minimize" the Kullback-Leibler divergence ("KL") between the teacher and student probabilities.
* **Negative Token-level Distillation:**
* "Teacher Prob" is represented by a gray bell curve.
* "Student Prob" is represented by a blue bell curve.
* The goal is to "Minimize" the Kullback-Leibler divergence ("KL") between the teacher and student probabilities.
* The outputs of the three loss components ("Sequence-level DPO Loss", "Positive Token-level Distillation", and "Negative Token-level Distillation") are combined into a "Joint Loss: Ldpo + Lpos + Lneg".
4. **Model Update:**
* The "Joint Loss" is used to "Update" the "Student Model (NBG4-3B)" in a feedback loop.
### Key Observations
* The diagram illustrates a training process that combines DPO and token-level distillation.
* The process involves a teacher model, a student model, and a preference filter.
* The loss function consists of three components: sequence-level DPO loss, positive token-level distillation, and negative token-level distillation.
* The joint loss is used to update the student model.
### Interpretation
The diagram describes a training methodology aimed at improving the performance of a student model by leveraging both a teacher model and a preference-based filtering mechanism. The use of DPO at the sequence level encourages the model to generate outputs that are preferred over others, while token-level distillation ensures that the student model learns to mimic the behavior of the teacher model at a finer granularity. The combination of these techniques likely leads to a more robust and accurate student model. The feedback loop from the joint loss back to the student model signifies an iterative training process where the model continuously learns and improves based on the calculated loss.