## Chart: Gemini-2.0-Flash Flips Proportion
### Overview
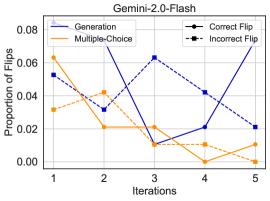
The image is a line chart titled "Gemini-2.0-Flash" showing the proportion of flips across iterations for different methods: Generation, Multiple-Choice, Correct Flip, and Incorrect Flip. The x-axis represents iterations (1 to 5), and the y-axis represents the proportion of flips (0.00 to 0.08).
### Components/Axes
* **Title:** Gemini-2.0-Flash
* **X-axis:** Iterations (1, 2, 3, 4, 5)
* **Y-axis:** Proportion of Flips (0.00, 0.02, 0.04, 0.06, 0.08)
* **Legend (top-left):**
* Generation (solid dark blue line)
* Multiple-Choice (solid orange line)
* Correct Flip (solid black line with circle markers)
* Incorrect Flip (dashed black line with square markers)
### Detailed Analysis
* **Generation (solid dark blue line):** Starts at approximately 0.053 at iteration 1, decreases to approximately 0.032 at iteration 2, increases to approximately 0.063 at iteration 3, decreases to approximately 0.018 at iteration 4, and increases to approximately 0.071 at iteration 5.
* **Multiple-Choice (solid orange line):** Starts at approximately 0.063 at iteration 1, decreases to approximately 0.042 at iteration 2, decreases to approximately 0.011 at iteration 3, decreases to approximately 0.000 at iteration 4, and increases to approximately 0.011 at iteration 5.
* **Correct Flip (solid black line with circle markers):** Starts at approximately 0.053 at iteration 1, decreases to approximately 0.032 at iteration 2, decreases to approximately 0.011 at iteration 3, increases to approximately 0.042 at iteration 4, and decreases to approximately 0.021 at iteration 5.
* **Incorrect Flip (dashed black line with square markers):** Starts at approximately 0.032 at iteration 1, increases to approximately 0.042 at iteration 2, decreases to approximately 0.021 at iteration 3, increases to approximately 0.042 at iteration 4, and decreases to approximately 0.000 at iteration 5.
### Key Observations
* The "Generation" method shows a fluctuating trend, with peaks at iterations 1, 3, and 5.
* The "Multiple-Choice" method generally decreases over iterations, reaching a low at iteration 4.
* The "Correct Flip" method shows a decrease from iteration 1 to 3, then an increase at iteration 4, followed by a decrease at iteration 5.
* The "Incorrect Flip" method shows an increase from iteration 1 to 2, then a decrease at iteration 3, followed by an increase at iteration 4, followed by a decrease at iteration 5.
### Interpretation
The chart compares the proportion of flips across iterations for different methods used by Gemini-2.0-Flash. The "Generation" method has the highest proportion of flips at the beginning and end of the iterations, while the "Multiple-Choice" method has the lowest proportion of flips at iteration 4. The "Correct Flip" and "Incorrect Flip" methods show similar trends, with fluctuations across iterations. The data suggests that the "Generation" method may be more prone to flips, while the "Multiple-Choice" method may be more stable. The fluctuations in the "Correct Flip" and "Incorrect Flip" methods may indicate that the model is learning and adjusting its behavior over time.