## Line Chart: Gemini-2.0-Flip Proportions Over Iterations
### Overview
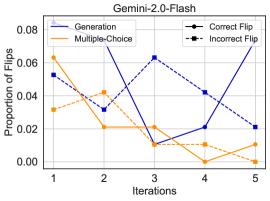
The image is a line chart titled "Gemini-2.0-Flash" that plots the "Proportion of Flips" against "Iterations" (1 through 5). It compares four different metrics or conditions, represented by distinct lines. The chart appears to track the frequency of certain "flip" events (likely changes in model output or decision) across sequential iterations for a system named Gemini-2.0-Flash.
### Components/Axes
* **Title:** "Gemini-2.0-Flash" (centered at the top).
* **Y-Axis:** Label is "Proportion of Flips". Scale ranges from 0.00 to 0.08, with major tick marks at 0.00, 0.02, 0.04, 0.06, and 0.08.
* **X-Axis:** Label is "Iterations". Discrete values are marked at 1, 2, 3, 4, and 5.
* **Legend:** Located in the top-right corner of the plot area. It defines four series:
1. **Generation:** Solid blue line.
2. **Multiple-Choice:** Solid orange line.
3. **Correct Flip:** Dashed blue line with circular markers (●).
4. **Incorrect Flip:** Dashed black line with square markers (■).
### Detailed Analysis
The following data points are approximate visual estimates from the chart.
**1. Generation (Solid Blue Line):**
* **Trend:** Starts very high, drops sharply, then fluctuates at a lower level.
* **Data Points:**
* Iteration 1: ~0.070
* Iteration 2: ~0.020
* Iteration 3: ~0.010
* Iteration 4: ~0.020
* Iteration 5: ~0.070
**2. Multiple-Choice (Solid Orange Line):**
* **Trend:** Starts low, peaks at iteration 2, then generally declines.
* **Data Points:**
* Iteration 1: ~0.030
* Iteration 2: ~0.040
* Iteration 3: ~0.020
* Iteration 4: ~0.000
* Iteration 5: ~0.010
**3. Correct Flip (Dashed Blue Line with Circles):**
* **Trend:** Shows a general downward trend from a moderate starting point.
* **Data Points:**
* Iteration 1: ~0.055
* Iteration 2: ~0.030
* Iteration 3: ~0.060
* Iteration 4: ~0.040
* Iteration 5: ~0.020
**4. Incorrect Flip (Dashed Black Line with Squares):**
* **Trend:** Starts high, dips, peaks at iteration 3, then declines.
* **Data Points:**
* Iteration 1: ~0.065
* Iteration 2: ~0.035
* Iteration 3: ~0.060
* Iteration 4: ~0.040
* Iteration 5: ~0.020
### Key Observations
1. **Inverse Relationship (Iteration 2):** At iteration 2, the "Generation" proportion plummets while the "Multiple-Choice" proportion reaches its peak.
2. **Convergence of Flips:** The "Correct Flip" and "Incorrect Flip" lines follow very similar paths from iteration 3 onward, converging at the same value (~0.040) at iteration 4 and ending at the same low value (~0.020) at iteration 5.
3. **High Initial Volatility:** The first two iterations show the most dramatic changes and divergence between the different metrics.
4. **Final State:** By iteration 5, the "Generation" proportion has returned to a high level similar to its start, while all other metrics ("Multiple-Choice", "Correct Flip", "Incorrect Flip") are at or near their lowest points.
### Interpretation
This chart likely visualizes the behavior of an AI model (Gemini-2.0-Flash) during a multi-step evaluation or refinement process. The "Proportion of Flips" probably measures how often the model changes its answer or output between iterations.
* **"Generation" vs. "Multiple-Choice":** The sharp inverse movement at iteration 2 suggests a fundamental shift in the model's behavior or the task's nature. It may indicate a transition from a generative, open-ended response mode to a more constrained, selection-based mode.
* **Flip Accuracy:** The close tracking of "Correct Flip" and "Incorrect Flip" lines, especially after iteration 3, is notable. It suggests that as the process continues, the model's tendency to change its mind becomes less discriminating—it becomes equally likely to flip to a correct or incorrect answer. The overall downward trend in flips after iteration 3 indicates the model's outputs are stabilizing.
* **Process Narrative:** The data tells a story of initial high instability and exploration (high flip rates), a major mode shift at iteration 2, followed by a period of converging and decreasing flip activity, leading to a more stable final state. The resurgence of the "Generation" flip rate at the end, while others remain low, is an anomaly that might indicate a final generative step or a different type of evaluation at iteration 5.