## Line Chart: Gemini-2.0-Flash Performance Across Iterations
### Overview
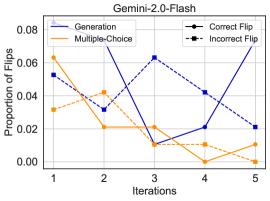
The chart visualizes the proportion of "Correct Flips" and "Incorrect Flips" for two methods ("Generation" and "Multiple-Choice") across five iterations. The y-axis represents the proportion of flips (0.00–0.08), while the x-axis tracks iterations (1–5). Two data series are plotted: a solid blue line for "Generation" and a dashed orange line for "Multiple-Choice." The legend in the top-right corner distinguishes "Correct Flip" (filled markers) and "Incorrect Flip" (hollow markers).
### Components/Axes
- **X-axis (Iterations)**: Labeled "Iterations" with discrete values 1, 2, 3, 4, 5.
- **Y-axis (Proportion of Flips)**: Labeled "Proportion of Flips" with a scale from 0.00 to 0.08 in increments of 0.02.
- **Legend**: Located in the top-right corner.
- "Correct Flip": Solid black circles (filled).
- "Incorrect Flip": Hollow black squares (unfilled).
- **Data Series**:
- **Generation**: Solid blue line with filled markers for correct flips and hollow markers for incorrect flips.
- **Multiple-Choice**: Dashed orange line with filled markers for correct flips and hollow markers for incorrect flips.
### Detailed Analysis
#### Generation (Blue Line)
- **Iteration 1**: Proportion of correct flips ≈ 0.075; incorrect flips ≈ 0.005.
- **Iteration 2**: Proportion of correct flips ≈ 0.03; incorrect flips ≈ 0.04.
- **Iteration 3**: Proportion of correct flips ≈ 0.06; incorrect flips ≈ 0.02.
- **Iteration 4**: Proportion of correct flips ≈ 0.04; incorrect flips ≈ 0.03.
- **Iteration 5**: Proportion of correct flips ≈ 0.02; incorrect flips ≈ 0.05.
#### Multiple-Choice (Orange Line)
- **Iteration 1**: Proportion of correct flips ≈ 0.06; incorrect flips ≈ 0.03.
- **Iteration 2**: Proportion of correct flips ≈ 0.02; incorrect flips ≈ 0.04.
- **Iteration 3**: Proportion of correct flips ≈ 0.01; incorrect flips ≈ 0.02.
- **Iteration 4**: Proportion of correct flips ≈ 0.01; incorrect flips ≈ 0.03.
- **Iteration 5**: Proportion of correct flips ≈ 0.005; incorrect flips ≈ 0.02.
### Key Observations
1. **Generation Method**:
- Shows significant volatility, with a peak in correct flips at iteration 3 (~0.06) and a trough at iteration 5 (~0.02).
- Incorrect flips increase sharply after iteration 3, reaching ~0.05 by iteration 5.
2. **Multiple-Choice Method**:
- Demonstrates a steady decline in correct flips from ~0.06 (iteration 1) to ~0.005 (iteration 5).
- Incorrect flips remain relatively stable (~0.02–0.04) but show a slight upward trend after iteration 3.
3. **Cross-Series Comparison**:
- At iteration 3, "Generation" outperforms "Multiple-Choice" in correct flips (0.06 vs. 0.01).
- By iteration 5, "Generation" has a higher proportion of incorrect flips (~0.05) compared to "Multiple-Choice" (~0.02).
### Interpretation
The data suggests that the "Generation" method initially performs better in terms of correct flips but becomes increasingly unstable over iterations, leading to higher incorrect flip rates. In contrast, the "Multiple-Choice" method shows consistent but declining performance, with fewer incorrect flips overall. The peak in correct flips for "Generation" at iteration 3 may indicate an optimal point before degradation, while the steady decline in "Multiple-Choice" could reflect inherent limitations in its approach. The divergence in trends highlights trade-offs between adaptability (Generation) and consistency (Multiple-Choice) in this context.