# Technical Document Extraction: Bar Chart Analysis
## Chart Type
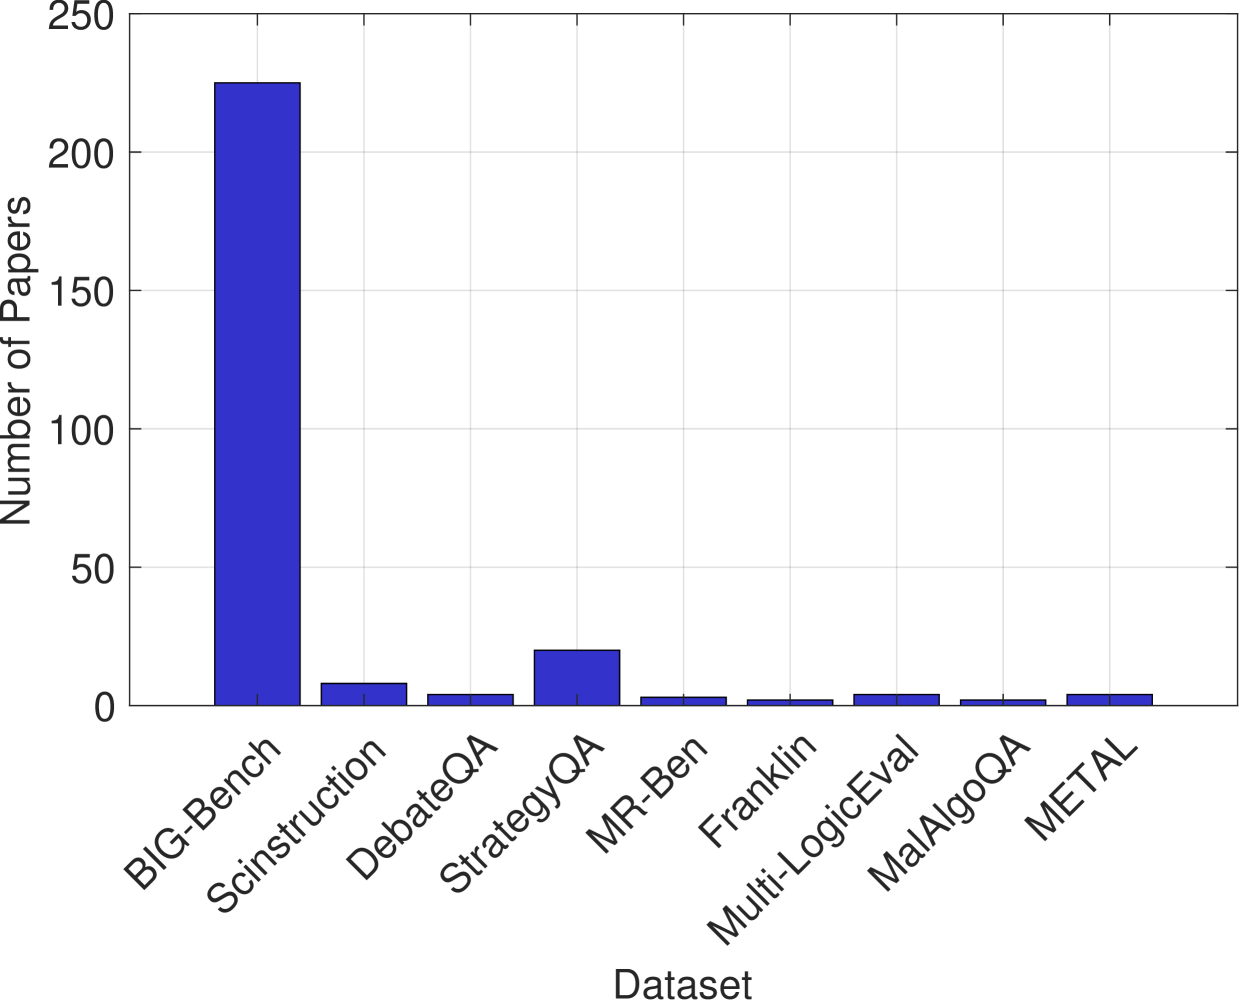
- **Bar Chart** (Vertical)
## Axis Labels
- **X-Axis (Categories):**
`Dataset`
Categories:
1. BIG-Bench
2. Scinstruc
3. DebateQA
4. StrategyQA
5. MR-Ben
6. Franklin
7. Multi-LogicEval
8. MalgoQA
9. METAL
- **Y-Axis (Quantitative):**
`Number of Papers`
Scale: 0 to 250 (increments of 50)
## Data Points
| Dataset | Approximate Number of Papers |
|------------------|------------------------------|
| BIG-Bench | 225 |
| Scinstruc | ~10 |
| DebateQA | ~5 |
| StrategyQA | ~20 |
| MR-Ben | ~5 |
| Franklin | ~3 |
| Multi-LogicEval | ~5 |
| MalgoQA | ~3 |
| METAL | ~5 |
## Key Trends
1. **Dominance of BIG-Bench:**
- The dataset `BIG-Bench` accounts for **~90% of all papers** (225 papers), dwarfing all other datasets.
2. **Secondary Datasets:**
- `StrategyQA` (~20 papers) is the second-largest dataset.
- Remaining datasets (`Scinstruc`, `DebateQA`, `MR-Ben`, `Franklin`, `Multi-LogicEval`, `MalgoQA`, `METAL`) each have **<10 papers**, with most clustered around **3–5 papers**.
3. **Data Distribution:**
- Highly skewed distribution, with a single outlier (`BIG-Bench`) and minimal representation for other datasets.
## Visual Elements
- **Bars:**
- All bars are **blue** (no legend present; uniform color).
- Bars are ordered left-to-right by dataset name.
- **Gridlines:**
- Horizontal gridlines at 50-paper intervals (0, 50, 100, 150, 200, 250).
- No vertical gridlines.
## Notes
- No embedded text or annotations within the chart.
- No legend or colorbar present.
- Dataset names are explicitly labeled on the x-axis.