\n
## Scatter Plot: Distribution of Factual Associations vs. Hallucination Types
### Overview
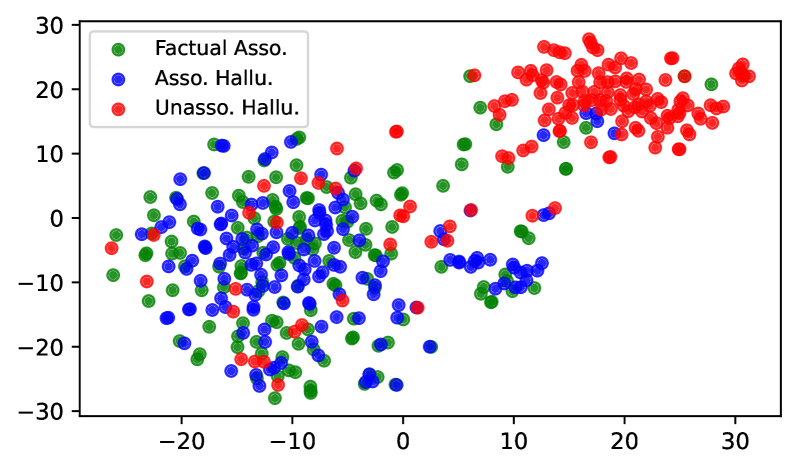
The image is a 2D scatter plot visualizing the distribution of three distinct categories of data points across a Cartesian coordinate system. The plot suggests a clustering analysis, likely from a machine learning or cognitive science context, comparing "Factual Associations" against two types of "Hallucinations" (Associated and Unassociated). The data points are colored circles, and a legend is provided for identification.
### Components/Axes
* **Legend:** Located in the top-left corner of the plot area. It contains three entries:
* Green circle: `Factual Asso.`
* Blue circle: `Asso. Hallu.`
* Red circle: `Unasso. Hallu.`
* **X-Axis:** Horizontal axis with a numerical scale. Major tick marks and labels are present at intervals of 10, ranging from approximately -25 to +30. The axis is not explicitly labeled with a title (e.g., "Dimension 1," "PC1").
* **Y-Axis:** Vertical axis with a numerical scale. Major tick marks and labels are present at intervals of 10, ranging from -30 to +30. The axis is not explicitly labeled with a title (e.g., "Dimension 2," "PC2").
* **Data Points:** Hundreds of filled circles plotted according to their (x, y) coordinates, colored per the legend.
### Detailed Analysis
**Spatial Distribution and Clustering:**
1. **Factual Asso. (Green):** These points are widely dispersed but show a primary concentration in the lower-left quadrant (negative X, negative Y). A secondary, sparser grouping extends towards the center and upper-right. The approximate center of the main cluster is around (-10, -10). The points span from roughly X: -25 to +25 and Y: -30 to +25.
2. **Asso. Hallu. (Blue):** This category forms a dense, tight cluster primarily located in the lower-left quadrant, heavily overlapping with the main cluster of green points. Its center is approximately (-15, -5). The spread is more confined than the green points, mostly between X: -25 to +5 and Y: -25 to +10.
3. **Unasso. Hallu. (Red):** This group forms a distinct, dense cluster in the upper-right quadrant (positive X, positive Y). Its center is approximately (+15, +20). The cluster is relatively compact, with points ranging from about X: 0 to +30 and Y: +5 to +30. A few red points are scattered outside this main cluster, notably one outlier near (-25, -5).
**Trend Verification:** There is no continuous line trend. The visual trend is one of **clustering and separation**. The blue and green points largely co-mingle in the lower-left region, while the red points form a separate, distinct cluster in the upper-right region. This suggests a significant dimensional difference between "Unassociated Hallucinations" and the other two categories.
### Key Observations
1. **Clear Cluster Separation:** The most prominent feature is the spatial separation between the main cluster of `Unasso. Hallu.` (red) and the intermixed clusters of `Factual Asso.` (green) and `Asso. Hallu.` (blue).
2. **Overlap of Factual and Associated Hallucination:** The green and blue points show substantial overlap, indicating these categories may share similar characteristics in the plotted feature space.
3. **Density Variation:** The red cluster appears the densest, followed by the blue cluster. The green points are the most scattered.
4. **Outliers:** A small number of points from each category lie outside their primary clusters. Most notably, a few red points are found within the lower-left region, and a few green points are found within the upper-right red cluster.
### Interpretation
This scatter plot likely visualizes the output of a dimensionality reduction technique (like t-SNE or PCA) applied to internal representations or embeddings from a language model or similar AI system. The data suggests:
* **Semantic or Representational Distance:** The spatial separation implies that the model's internal processing of "Unassociated Hallucinations" is fundamentally different (occupying a distinct region of the latent space) from its processing of "Factual Associations" and "Associated Hallucinations."
* **Proximity of Fact and Associated Error:** The close proximity and overlap of factual associations and associated hallucinations suggest the model may generate the latter by making plausible but incorrect leaps from factual knowledge bases. They are "near" facts in the representational space.
* **Distinct Nature of Unassociated Hallucination:** The isolated red cluster indicates that unassociated hallucinations—errors not grounded in the immediate context or factual knowledge—arise from a different mechanism or represent a more severe deviation in the model's processing.
* **Model Behavior Insight:** This visualization provides evidence for a potential diagnostic tool: monitoring a model's output embeddings could help classify the type of error (factual, associated hallucination, unassociated hallucination) based on their location in this feature space, aiding in targeted debugging and alignment research.
**Language Declaration:** All text in the image is in English.