## Heatmap: Syllogism Format vs. Predicted VALID Outcomes
### Overview
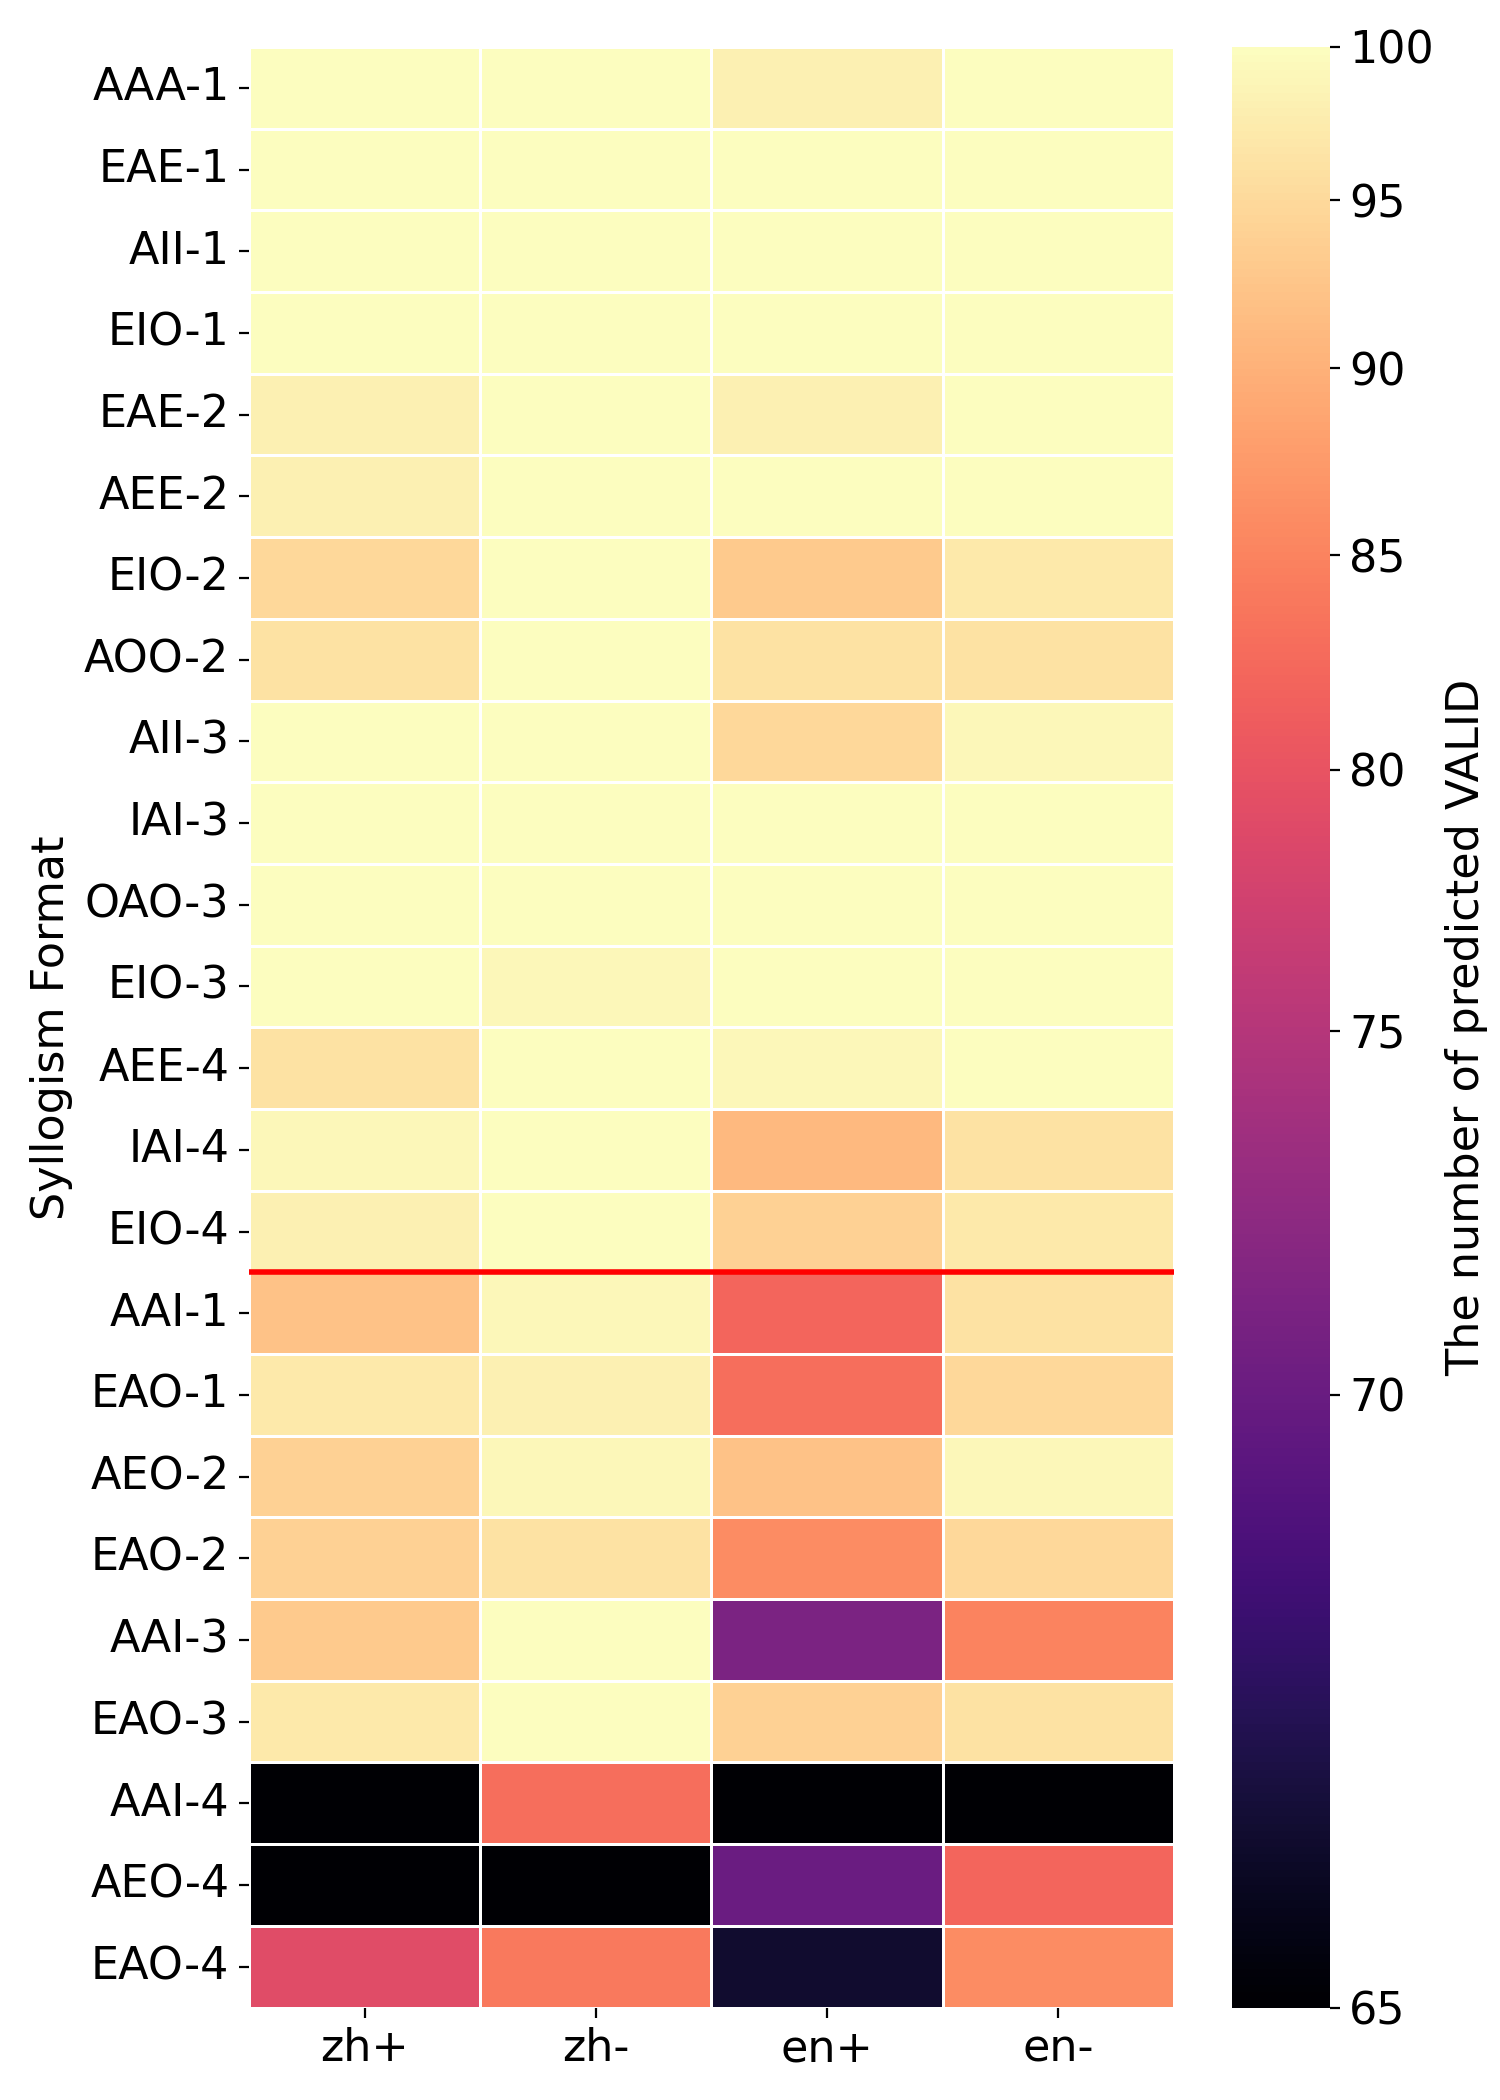
The image is a heatmap visualizing the relationship between syllogism formats (rows) and variables (columns: zh+, zh-, en+, en-). Color intensity represents the number of predicted VALID outcomes, with a color scale from black (65) to yellow (100). A red horizontal line at EIO-4 serves as a reference point.
### Components/Axes
- **Y-Axis (Syllogism Format)**:
- Categories: AAA-1, EAE-1, AII-1, EIO-1, EAE-2, AEE-2, EIO-2, AOO-2, AII-3, IAI-3, OAO-3, EIO-3, AEE-4, IAI-4, EIO-4, AAI-1, EAO-1, AEO-2, EAO-2, AAI-3, EAO-3, AAI-4, AEO-4, EAO-4.
- Positioned vertically on the left.
- **X-Axis (Variables)**:
- Categories: zh+, zh-, en+, en-.
- Positioned horizontally at the bottom.
- **Legend**:
- Color scale from black (65) to yellow (100), labeled "The number of predicted VALID."
- Located on the right side.
- **Red Line**:
- Horizontal line at EIO-4, dividing the heatmap into upper and lower sections.
### Detailed Analysis
- **Color Distribution**:
- **Upper Section (Above Red Line)**: Predominantly yellow (90–100), indicating high predicted VALID counts.
- **Lower Section (Below Red Line)**: Gradual shift to darker colors (red to black), with the lowest values (black) in the bottom-right quadrant (AAI-4, AEO-4, EAO-4 with en+ and en-).
- **Notable Exceptions**:
- AAI-3 (en+) and AAI-4 (en+) show purple (70–75), lower than surrounding cells.
- EAO-4 (en+) is dark purple (65–70), the lowest value in the heatmap.
### Key Observations
1. **High Predicted VALIDs**: Most syllogism formats (e.g., AAA-1, EAE-1) consistently show high values (90–100) across all variables.
2. **Critical Threshold**: The red line at EIO-4 marks a boundary where predicted VALIDs drop significantly below 90.
3. **Lowest Values**: The bottom-right quadrant (AAI-4, AEO-4, EAO-4 with en+ and en-) contains the darkest cells (65–70), suggesting poor performance in these combinations.
4. **Variable Impact**:
- `en+` and `en-` variables correlate with lower values in the lower rows.
- `zh+` and `zh-` variables maintain higher values even in lower rows.
### Interpretation
The heatmap reveals that syllogism formats generally perform well in predicting VALID outcomes, but specific combinations (e.g., AAI-4 with en+ and en-) exhibit significantly lower reliability. The red line at EIO-4 may indicate a critical threshold where performance declines. The dominance of dark colors in the lower rows suggests that certain syllogism formats (e.g., AAI-4, EAO-4) are less robust when paired with `en+` and `en-` variables. This could imply limitations in the model's ability to handle these combinations or the need for further validation of these syllogism structures. The data underscores the importance of contextual factors (variables) in determining the reliability of syllogistic reasoning.