TECHNICAL ASSET FINGERPRINT
ec514fc9963017d675607cbe
Click to view fullscreen
Press ESC or click to close
FOUND IN PAPERS
EXPERT: healer-alpha-free VERSION 1
RUNTIME: free/openrouter/healer-alpha
INTEL_VERIFIED
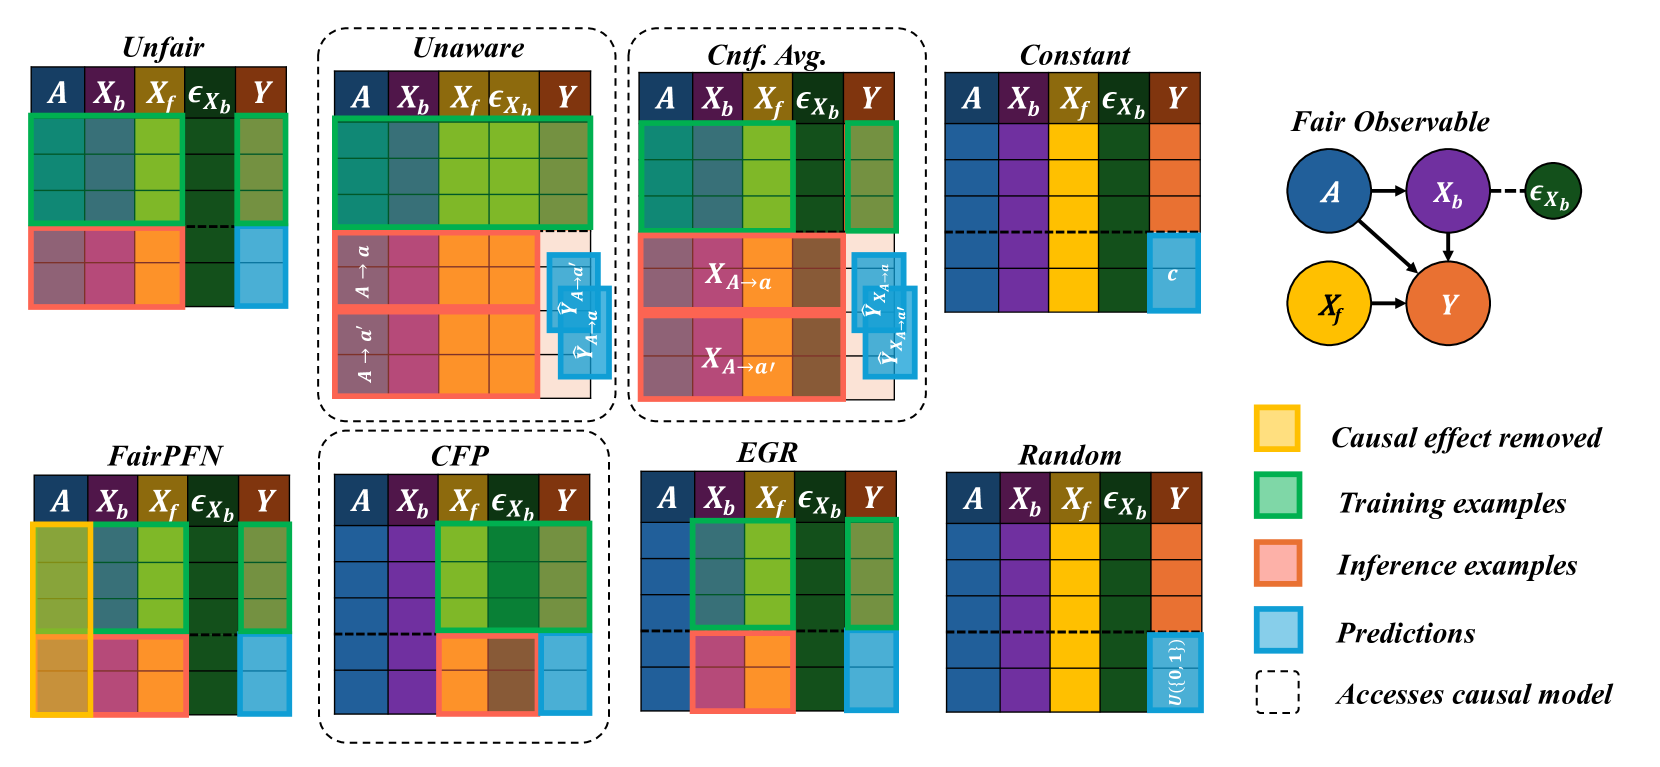
## Diagram: Comparison of Fairness Intervention Methods in Causal Models
### Overview
The image is a technical diagram comparing eight different algorithmic approaches to achieving fairness in predictive modeling, framed within a causal inference context. It visually contrasts how each method handles sensitive attributes, features, and predictions during training and inference phases. The diagram is structured as a grid of eight method-specific blocks, accompanied by a causal graph and a color-coded legend.
### Components/Axes
**Main Grid Structure:**
- **Rows:** Two rows of four method blocks each.
- **Columns within each block:** Five columns labeled with variable names:
- `A`: Sensitive attribute (e.g., race, gender).
- `X_b`: Background features (potentially influenced by `A`).
- `X_f`: Foreground features (potentially causal for `Y` but independent of `A`).
- `ε_Xb`: Noise or exogenous error term for `X_b`.
- `Y`: Outcome variable to be predicted.
- **Vertical Division:** Each block is split horizontally by a dashed line. The area above represents the **training phase**, and the area below represents the **inference phase**.
**Legend (Right Side):**
- **Yellow Box:** "Causal effect removed"
- **Green Box:** "Training examples"
- **Pink/Salmon Box:** "Inference examples"
- **Blue Box:** "Predictions"
- **Dashed Outline:** "Accesses causal model"
**Causal Graph (Top Right):**
- Titled "Fair Observable".
- Nodes: `A` (blue), `X_b` (purple), `ε_Xb` (green), `X_f` (yellow), `Y` (orange).
- Directed edges (arrows):
- `A` → `X_b`
- `A` → `Y`
- `X_b` → `Y`
- `ε_Xb` → `X_b`
- `X_f` → `Y`
### Detailed Analysis
**Method-by-Method Breakdown:**
1. **Unfair:**
- **Training:** All variables (`A`, `X_b`, `X_f`, `ε_Xb`, `Y`) are shown in green (training examples).
- **Inference:** All variables are shown in pink (inference examples). Predictions (`Ŷ`) for `Y` are in blue.
- **Interpretation:** A standard predictive model with no fairness constraints. It uses all available data, including the sensitive attribute `A`, directly for training and prediction.
2. **Unaware (Accesses causal model):**
- **Training:** Same as "Unfair" (all green).
- **Inference:** The `A` column shows two counterfactual scenarios: `A → a` and `A → a'`. The prediction column shows corresponding counterfactual predictions: `Ŷ_{A→a}` and `Ŷ_{A→a'}`.
- **Interpretation:** This method is "unaware" of the sensitive attribute during training but uses the causal model at inference to generate predictions under different counterfactual values of `A` (e.g., `a` and `a'`). The final prediction is likely an average or combination of these.
3. **Cntf. Avg. (Counterfactual Averaging) (Accesses causal model):**
- **Training:** Same as "Unfair" (all green).
- **Inference:** The `X_b` and `X_f` columns show counterfactual feature values: `X_{A→a}` and `X_{A→a'}`. The prediction column shows `Ŷ_{X_{A→a}}` and `Ŷ_{X_{A→a'}}`.
- **Interpretation:** This method uses the causal model to compute what the features (`X_b`, `X_f`) *would have been* under different values of `A`, and then makes predictions based on these counterfactual features. The final prediction is an average over these counterfactuals.
4. **Constant:**
- **Training:** Same as "Unfair" (all green).
- **Inference:** The prediction column shows a constant value `c` (blue).
- **Interpretation:** A trivial fairness method that ignores all input features and always outputs the same constant prediction, thereby achieving perfect fairness (no disparity) but zero utility.
5. **FairPFN:**
- **Training:** The `A` column is yellow, indicating the "causal effect removed" during training. Other columns are green.
- **Inference:** The `A` column remains yellow. Other columns are pink, with predictions in blue.
- **Interpretation:** This method explicitly removes the causal influence of the sensitive attribute `A` from the model during the training phase itself.
6. **CFP (Accesses causal model):**
- **Training:** All columns are green.
- **Inference:** The `X_f` and `ε_Xb` columns are colored brown (a color not in the legend, possibly indicating a specific transformation or intervention). Predictions are in blue.
- **Interpretation:** The exact mechanism is less clear from the color coding alone, but it accesses the causal model and appears to perform some intervention or transformation on the foreground features (`X_f`) and the noise term (`ε_Xb`) during inference.
7. **EGR:**
- **Training:** All columns are green.
- **Inference:** The `X_b` column is pink. The prediction for `Y` is blue.
- **Interpretation:** This method seems to focus its intervention on the background features (`X_b`) during the inference phase, while using standard training.
8. **Random:**
- **Training:** All columns are green.
- **Inference:** The prediction column shows `u(0,1)` (blue), indicating a random value drawn from a uniform distribution between 0 and 1.
- **Interpretation:** Another trivial baseline that makes random predictions, achieving fairness through randomness but with no predictive utility.
### Key Observations
- **Causal Model Access:** Three methods (Unaware, Cntf. Avg., CFP) are explicitly marked as accessing the causal model (dashed outline). This suggests they require knowledge of the underlying causal graph (shown on the right) to function.
- **Phase-Specific Interventions:** Most methods apply their fairness intervention during the **inference phase** (below the dashed line), not during training. The major exception is **FairPFN**, which intervenes during training (yellow in the `A` column above the line).
- **Variable Targeting:** Different methods target different variables for intervention: `A` (FairPFN), counterfactual `A` (Unaware), counterfactual features (Cntf. Avg.), background features `X_b` (EGR), or other transformations (CFP).
- **Baselines:** "Constant" and "Random" serve as trivial fairness baselines that sacrifice all predictive accuracy.
### Interpretation
This diagram is a conceptual taxonomy of algorithmic fairness strategies within a causal inference framework. It illustrates a fundamental trade-off: how to modify a predictive model to prevent unfair discrimination (often traced to the sensitive attribute `A`) while preserving useful information for prediction.
The **causal graph** is central to the diagram's logic. It defines the "ground truth" relationships: `A` influences both `X_b` and `Y` directly, and `X_b` also influences `Y`. Fairness interventions aim to block the unfair path `A → Y` or `A → X_b → Y`. The methods differ in *where* and *how* they intervene:
- **Pre-processing/In-processing (FairPFN):** Alters the model or data before or during training to remove the effect of `A`.
- **Post-processing/Inference-time (Unaware, Cntf. Avg., EGR, CFP):** Uses the trained model but modifies inputs or outputs at prediction time, often leveraging the causal model to simulate counterfactuals ("What would the prediction be if `A` were different?").
The diagram suggests that methods accessing the causal model (dashed boxes) can perform more precise, targeted interventions (like computing exact counterfactuals) compared to methods that do not. However, this requires strong assumptions and knowledge of the true causal structure, which is often unknown in practice. The presence of trivial baselines ("Constant", "Random") highlights that achieving fairness is trivial if one is willing to completely abandon predictive utility. The core challenge, embodied by the other six methods, is to find a balance—to remove unfair bias while retaining as much predictive power as possible.
DECODING INTELLIGENCE...