## Heatmap Diagram: Fairness Method Component Analysis
### Overview
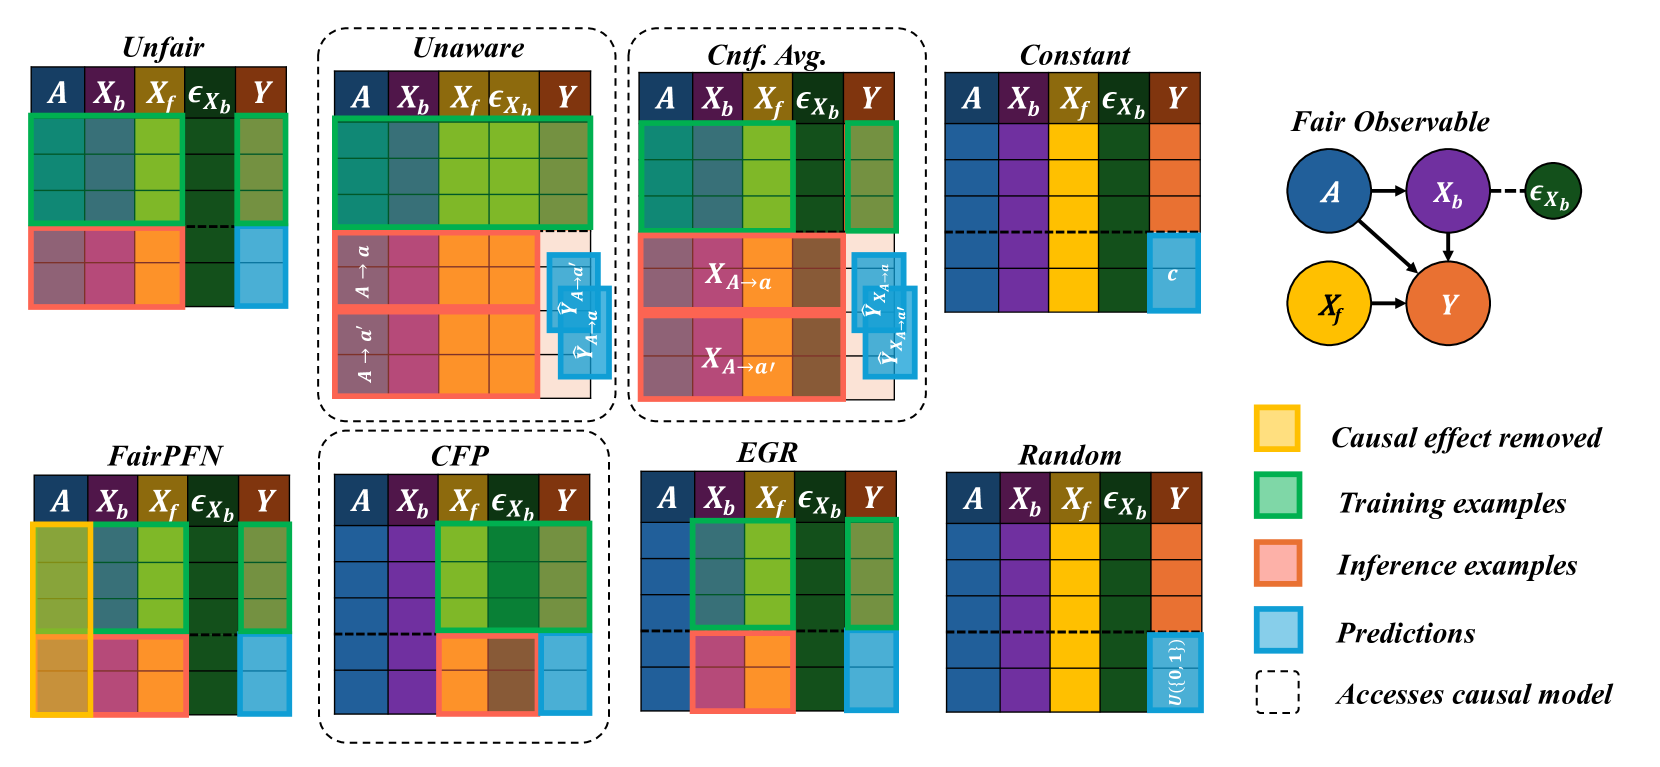
The image presents a comparative analysis of eight fairness methods in machine learning through a grid of heatmaps. Each heatmap visualizes the presence/absence of five key components (A, Xb, Xf, εXb, Y) across training and inference phases, with color-coded annotations indicating component status and causal relationships.
### Components/Axes
**Main Elements:**
1. **Top Row (4 Methods):** Unfair, Unaware, Cntf. Avg., Constant
2. **Bottom Row (4 Methods):** FairPFN, CFP, EGR, Random
3. **Columns (Components):** A (action), Xb (background variable), Xf (fairness variable), εXb (bias term), Y (outcome)
4. **Legend (Right Side):**
- Yellow: Causal effect removed
- Green: Training examples
- Red: Inference examples
- Blue: Predictions
- Dashed lines: Accesses causal model
5. **Causal Diagram (Bottom Right):** Nodes A→Xb→εXb→Y and Xf→Y with directional arrows
**Spatial Grounding:**
- Legend positioned vertically on the far right
- Causal diagram occupies bottom-right quadrant
- Heatmaps arranged in 2x4 grid (top row: 4 methods, bottom row: 4 methods)
- Component labels (A, Xb, Xf, εXb, Y) consistently positioned at top of each heatmap
### Detailed Analysis
**Unfair Method:**
- All cells colored (green/red/yellow)
- No causal effect removal (no yellow)
- No causal model access (no dashed lines)
**Unaware Method:**
- Yellow blocks in bottom-left quadrant (A→a', Y_A→a')
- Indicates causal effect removal in specific components
**Cntf. Avg. Method:**
- Yellow blocks in bottom-left quadrant (X_A→a, X_A→a')
- Dashed lines in bottom-right quadrant (Y_X→a, Y_X→a')
- Shows partial causal model access
**Constant Method:**
- Single blue cell labeled "c" in bottom-right
- All other cells uncolored
- Suggests constant prediction across components
**FairPFN Method:**
- Yellow blocks in bottom-left quadrant (A, Xb)
- Green blocks in top-right quadrant (Xf, εXb, Y)
- No causal model access
**CFP Method:**
- Yellow blocks in bottom-left quadrant (A, Xb)
- Green blocks in top-right quadrant (Xf, εXb, Y)
- Red blocks in bottom-right quadrant (Y)
- Shows inference example differentiation
**EGR Method:**
- Yellow blocks in bottom-left quadrant (A, Xb)
- Green blocks in top-right quadrant (Xf, εXb, Y)
- Red blocks in bottom-right quadrant (Y)
- Similar to CFP but with different spatial distribution
**Random Method:**
- Yellow blocks in bottom-left quadrant (A, Xb)
- Green blocks in top-right quadrant (Xf, εXb, Y)
- Blue blocks in bottom-right quadrant (Y)
- Uniform distribution across components
### Key Observations
1. **Causal Effect Removal:** All methods except Unfair show some yellow blocks (causal effect removal)
2. **Causal Model Access:** Only Cntf. Avg. and CFP/EGR methods show dashed lines
3. **Prediction Uniformity:** Constant method shows single blue cell vs. others with multiple colored cells
4. **Component Isolation:** Xf and εXb consistently appear in top-right quadrant across methods
5. **Y Component:** Appears in bottom-right quadrant in all methods except Constant
### Interpretation
The diagram demonstrates how different fairness methods manipulate causal components to achieve fairness:
- **Unfair** represents the baseline with all components intact
- **Unaware** and **FairPFN** show selective causal effect removal
- **Cntf. Avg.** combines causal effect removal with model access
- **CFP** and **EGR** demonstrate inference-phase component differentiation
- **Random** shows uniform component distribution
- **Constant** represents extreme simplification
The causal diagram reveals that bias (εXb) flows through background variables (Xb) to affect outcomes (Y), with fairness variables (Xf) providing alternative pathways. Methods accessing the causal model (dashed lines) appear to better isolate bias components, suggesting that causal awareness enables more targeted fairness interventions. The Constant method's single-cell approach implies a trade-off between fairness complexity and model simplicity.