## Scatter Plot: Accuracy of Individual Treatment Effect (ITE) Estimation
### Overview
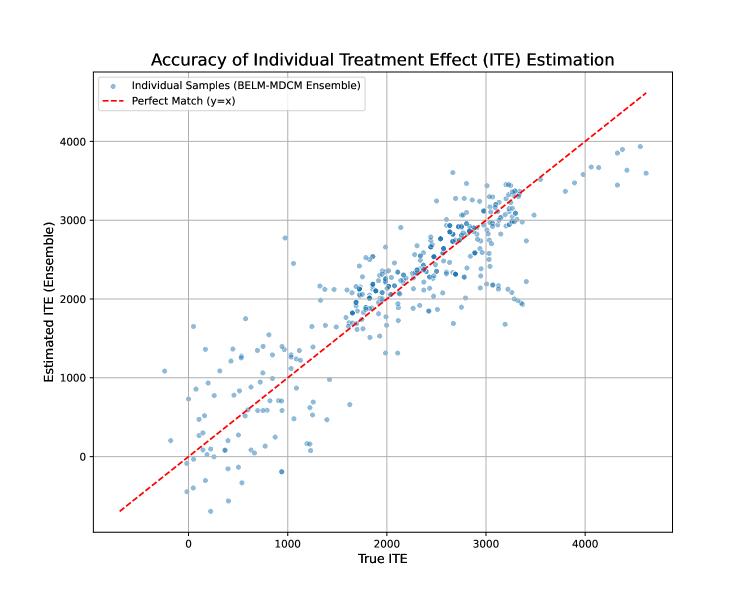
The image is a scatter plot showing the accuracy of Individual Treatment Effect (ITE) estimation. The plot compares the "True ITE" on the x-axis against the "Estimated ITE (Ensemble)" on the y-axis. Individual data points, representing individual samples, are plotted as light blue circles. A red dashed line represents a "Perfect Match" where y = x. The plot includes a grid for easier reading of values.
### Components/Axes
* **Title:** Accuracy of Individual Treatment Effect (ITE) Estimation
* **X-axis:** True ITE
* Scale: 0 to 4000, with gridlines at intervals of 1000.
* **Y-axis:** Estimated ITE (Ensemble)
* Scale: 0 to 4000, with gridlines at intervals of 1000.
* **Legend:** Located in the top-left corner.
* Individual Samples (BELM-MDCM Ensemble): Represented by light blue circles.
* Perfect Match (y=x): Represented by a red dashed line.
### Detailed Analysis
* **Individual Samples (BELM-MDCM Ensemble):** The light blue data points are scattered around the red dashed line. The density of points appears higher between True ITE values of 2000 and 3000. There is a noticeable spread of the estimated ITE values for any given True ITE value, indicating some degree of estimation error.
* **Perfect Match (y=x):** The red dashed line represents the ideal scenario where the estimated ITE perfectly matches the true ITE. It starts at approximately (-500, -500) and extends to (4500, 4500).
### Key Observations
* The estimated ITE values tend to cluster around the perfect match line, but with significant variance.
* There are more data points above the perfect match line for lower True ITE values (e.g., True ITE < 2000), suggesting a tendency to overestimate the ITE in this range.
* Conversely, there are more data points below the perfect match line for higher True ITE values (e.g., True ITE > 3000), suggesting a tendency to underestimate the ITE in this range.
### Interpretation
The scatter plot illustrates the accuracy of the BELM-MDCM Ensemble method for estimating Individual Treatment Effects. While the estimates generally follow the trend of the true ITE, there is a considerable amount of error, as indicated by the spread of the data points around the "Perfect Match" line. The tendency to overestimate ITE for lower true values and underestimate for higher true values suggests a potential bias in the estimation method. The clustering of points between 2000 and 3000 True ITE indicates that the model performs relatively better in that range. Overall, the plot highlights the need for further refinement of the estimation method to reduce variance and mitigate potential biases.