## Line Charts: Performance Comparison of Sorting Algorithms
### Overview
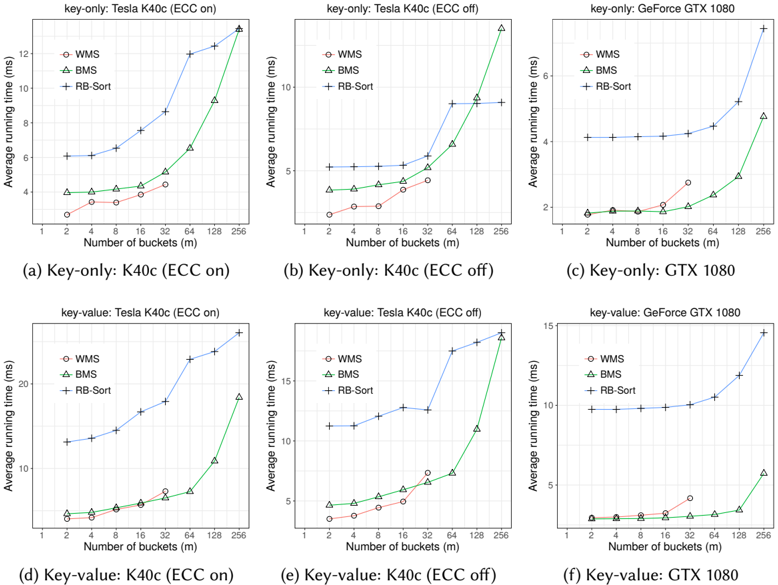
The image presents six line charts comparing the average running time (in milliseconds) of three sorting algorithms (WMS, BMS, and RB-Sort) across different numbers of buckets (m). The charts are arranged in a 2x3 grid. The top row shows results for "key-only" sorting, while the bottom row shows results for "key-value" sorting. The columns represent different hardware configurations: Tesla K40c with ECC on, Tesla K40c with ECC off, and GeForce GTX 1080.
### Components/Axes
* **Title:** Each chart has a title indicating the type of sorting (key-only or key-value) and the hardware configuration used.
* **X-axis:** Number of buckets (m), with values 1, 2, 4, 8, 16, 32, 64, 128, and 256.
* **Y-axis:** Average running time (ms), with a scale that varies slightly between charts but generally ranges from 0 to 12 or 0 to 20.
* **Legend:** Each chart includes a legend in the top-left corner identifying the three sorting algorithms:
* WMS (represented by circles)
* BMS (represented by triangles)
* RB-Sort (represented by plus signs)
### Detailed Analysis
**Chart (a): Key-only: K40c (ECC on)**
* **WMS (circles):** Relatively flat, hovering around 3 ms. Values are approximately: (1, 2.8), (2, 3.0), (4, 3.2), (8, 3.3), (16, 3.4), (32, 3.5), (64, 3.6), (128, 3.7), (256, 3.8).
* **BMS (triangles):** Starts around 4 ms and increases gradually. Values are approximately: (1, 4.0), (2, 4.2), (4, 4.3), (8, 4.4), (16, 4.5), (32, 5.0), (64, 6.5), (128, 9.5), (256, 12.5).
* **RB-Sort (plus signs):** Starts around 6 ms and increases sharply. Values are approximately: (1, 6.0), (2, 6.5), (4, 6.6), (8, 7.0), (16, 7.5), (32, 8.0), (64, 9.0), (128, 11.5), (256, 13.0).
**Chart (b): Key-only: K40c (ECC off)**
* **WMS (circles):** Relatively flat, hovering around 3 ms. Values are approximately: (1, 3.0), (2, 3.2), (4, 3.3), (8, 3.4), (16, 3.5), (32, 3.6), (64, 3.7), (128, 3.8), (256, 3.9).
* **BMS (triangles):** Starts around 4 ms and increases gradually. Values are approximately: (1, 3.8), (2, 4.0), (4, 4.1), (8, 4.2), (16, 4.3), (32, 4.5), (64, 5.2), (128, 7.5), (256, 9.5).
* **RB-Sort (plus signs):** Starts around 4 ms and increases sharply. Values are approximately: (1, 4.0), (2, 4.2), (4, 4.4), (8, 4.6), (16, 5.0), (32, 5.5), (64, 6.0), (128, 8.0), (256, 9.5).
**Chart (c): Key-only: GTX 1080**
* **WMS (circles):** Relatively flat, hovering around 2 ms. Values are approximately: (1, 1.8), (2, 1.9), (4, 2.0), (8, 2.1), (16, 2.2), (32, 2.3), (64, 2.4), (128, 2.5), (256, 2.6).
* **BMS (triangles):** Starts around 2 ms and increases gradually. Values are approximately: (1, 1.8), (2, 1.9), (4, 2.0), (8, 2.1), (16, 2.2), (32, 2.4), (64, 3.0), (128, 4.0), (256, 5.0).
* **RB-Sort (plus signs):** Starts around 4 ms and increases sharply. Values are approximately: (1, 4.0), (2, 4.1), (4, 4.2), (8, 4.3), (16, 4.4), (32, 4.5), (64, 4.7), (128, 5.2), (256, 7.0).
**Chart (d): Key-value: K40c (ECC on)**
* **WMS (circles):** Relatively flat, hovering around 6 ms. Values are approximately: (1, 5.8), (2, 6.0), (4, 6.2), (8, 6.3), (16, 6.4), (32, 6.5), (64, 7.0), (128, 7.5), (256, 8.0).
* **BMS (triangles):** Starts around 2 ms and increases sharply. Values are approximately: (1, 1.8), (2, 2.0), (4, 2.2), (8, 2.5), (16, 3.0), (32, 4.0), (64, 6.0), (128, 12.0), (256, 18.0).
* **RB-Sort (plus signs):** Starts around 12 ms and increases gradually. Values are approximately: (1, 12.5), (2, 13.0), (4, 13.2), (8, 13.5), (16, 14.0), (32, 14.5), (64, 15.5), (128, 17.5), (256, 20.0).
**Chart (e): Key-value: K40c (ECC off)**
* **WMS (circles):** Relatively flat, hovering around 6 ms. Values are approximately: (1, 5.8), (2, 6.0), (4, 6.2), (8, 6.3), (16, 6.4), (32, 6.5), (64, 7.0), (128, 7.5), (256, 8.0).
* **BMS (triangles):** Starts around 2 ms and increases sharply. Values are approximately: (1, 1.8), (2, 2.0), (4, 2.2), (8, 2.5), (16, 3.0), (32, 4.0), (64, 6.0), (128, 10.0), (256, 14.0).
* **RB-Sort (plus signs):** Starts around 10 ms and increases gradually. Values are approximately: (1, 10.0), (2, 10.5), (4, 11.0), (8, 11.5), (16, 12.0), (32, 12.5), (64, 13.0), (128, 14.0), (256, 15.0).
**Chart (f): Key-value: GTX 1080**
* **WMS (circles):** Relatively flat, hovering around 2 ms. Values are approximately: (1, 1.8), (2, 1.9), (4, 2.0), (8, 2.1), (16, 2.2), (32, 2.3), (64, 2.4), (128, 2.5), (256, 2.6).
* **BMS (triangles):** Starts around 2 ms and increases gradually. Values are approximately: (1, 1.8), (2, 1.9), (4, 2.0), (8, 2.1), (16, 2.2), (32, 2.4), (64, 3.0), (128, 4.0), (256, 5.5).
* **RB-Sort (plus signs):** Starts around 10 ms and increases gradually. Values are approximately: (1, 10.0), (2, 10.1), (4, 10.2), (8, 10.3), (16, 10.4), (32, 10.5), (64, 11.0), (128, 12.0), (256, 14.5).
### Key Observations
* **WMS:** The WMS algorithm consistently exhibits the lowest running time and remains relatively stable regardless of the number of buckets.
* **BMS:** The BMS algorithm generally has a low running time for a small number of buckets, but the running time increases significantly as the number of buckets increases, especially for key-value sorting.
* **RB-Sort:** The RB-Sort algorithm generally has the highest running time, especially for key-value sorting.
* **Hardware Impact:** The GTX 1080 generally results in lower running times compared to the K40c, especially for the RB-Sort algorithm.
* **ECC Impact:** Turning ECC off on the K40c generally results in slightly lower running times.
* **Key-value vs. Key-only:** Key-value sorting generally results in higher running times compared to key-only sorting, especially for the BMS and RB-Sort algorithms.
### Interpretation
The data suggests that the WMS algorithm is the most efficient for this particular task, as it consistently exhibits the lowest running time across all hardware configurations and sorting types. The BMS algorithm is efficient for a small number of buckets but becomes less efficient as the number of buckets increases. The RB-Sort algorithm is generally the least efficient.
The choice of hardware also has a significant impact on performance. The GTX 1080 generally outperforms the K40c, suggesting that it is better suited for this type of sorting task. Turning ECC off on the K40c can also improve performance, but this may come at the cost of reduced data integrity.
The type of sorting (key-only vs. key-value) also affects performance. Key-value sorting generally results in higher running times, suggesting that it is a more complex task.